
As earning season commences in the United States, most investors have their eyes set on the results from behemoths like Microsoft, Meta, Coca-Cola, and McDonald’s. Some alternatives have yet to be discussed much and are off the grid of many investors.
Three companies forming part of the renewable energy value chain will release results from power generation, technology, and solar PV modules this week. Starting things off will be NextEra Energy (NEE) with the interim results before the US markets open today, followed by First Solar (FSLR) and Enphase Energy (ENPH) on Thursday after the US markets close. Below is an illustration of the year-to-date performance of the three companies forementioned compared to the S&P 500 index, and we see that this year that First Solar has been consistently outperforming the index with a performance of 35.44%. The remaining two companies have had a negative year so far, NextEra Energy and Enphase Energy, with a performance of -8.77% and 29.81%, respectively.
There is much validity to the assumption that renewable energy is the way of the future of energy. Renewable electricity capacity growth reached a record in 2022, and the International Energy Agency (IEA) forecasts that it will grow by 85% more quickly between 2022 and 2027 than it did over the previous five years. By 2025, the IEA projects that renewable energy will surpass all other electricity-producing sources.
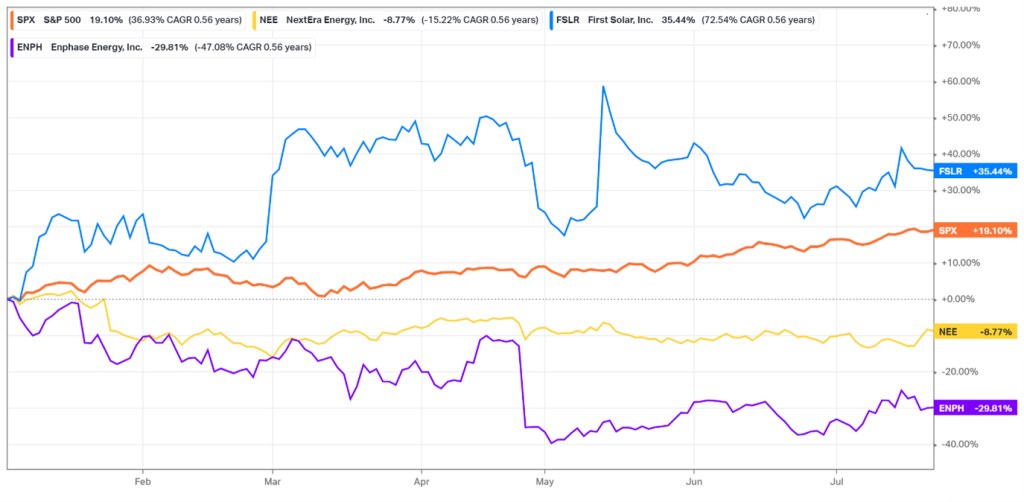
Figure 1: Normalised year-to-date performance for the S&P 500, NextEra Energy, First Solar, and Enphase Energy
NextEra Energy (NEE)
NextEra Energy, Inc. develops, constructs, and operates long-term contracted assets such as renewable generation, battery storage projects, and electric transmission facilities. NextEra Energy is the world’s biggest solar, wind, nuclear, coal, and natural gas-powered electricity generator. The most significant electrical utility in the United States is owned and run by the same firm. With a sizable pipeline, NextEra Energy may double its capacity for renewable power as early as 2026. Up to this point, NextEra Energy has achieved its growth objectives, with its knowledge and solid balance sheet playing a crucial role.
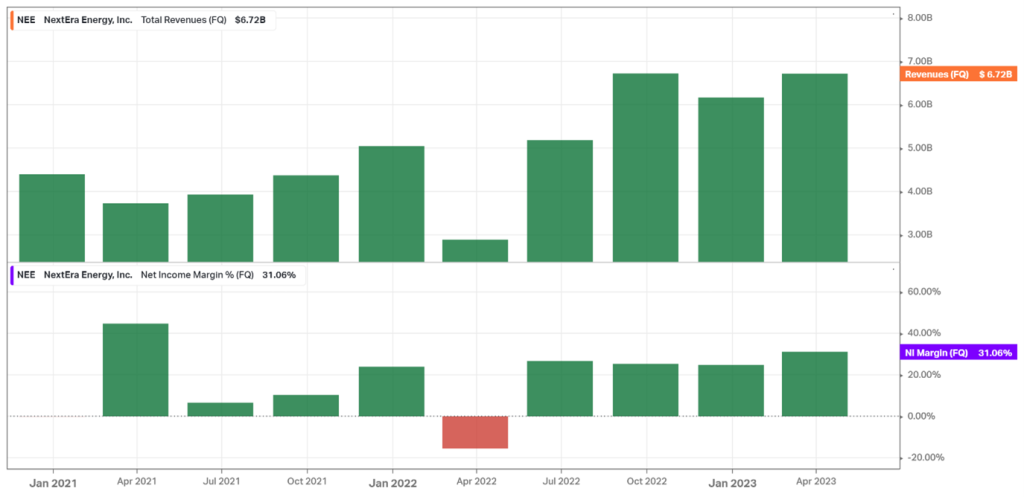
Figure 2: NextEra Energy’s quarterly Total Revenue and Net Income margin performance
The company has been growing its revenue steadily quarter on quarter, bringing in $6.72 billion in the first quarter of 2023. The business has also kept a steady Net Income Margin of mid-20 %, and last quarter reached 31%, the best quarter since Q1 in 2021. Between 2007 and 2022, NextEra Energy grew its adjusted earnings per share by a compound annual growth rate (CAGR) of 8.3% and dividends by a CAGR of 9.9%. Ahead of today’s release, analysts estimate that EPS will be 0.8187 and revenue will be $6.39 billion.
Technical Analysis
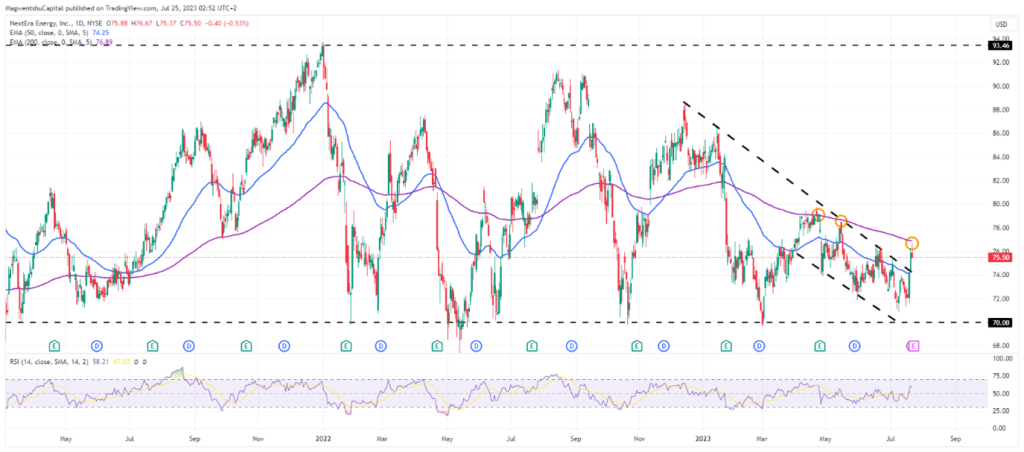
Figure 3: Daily chart from March 2021 for NextEra Energy
The share price peaked on the last day of 2021 at $93.73 to trade at an intraday low of 69.79 in under one month on 28 January 2022. The share has been trading sideways since the share price definitively broke above $70 in October 2020 and had been trading between the range of 93.46 and $70. It has been in a downward trend since 13 December 2022, when the share price dropped drastically following the earning results on 25 January 2023, where the revenue missed the estimates by 2.18%. The share price was punished by investors and reached the traded slightly below the support line and traded at a low of 69.64.
Starting 30 March 2023, the share price entered a new downward channel trend. Last Friday, the share price broke above the upper trend line, and on Monday, it traded just below the 200-day exponential moving average. The share price has yet to break past the 200-day EMA and has failed recently in April and May, respectively.
Comparative valuation
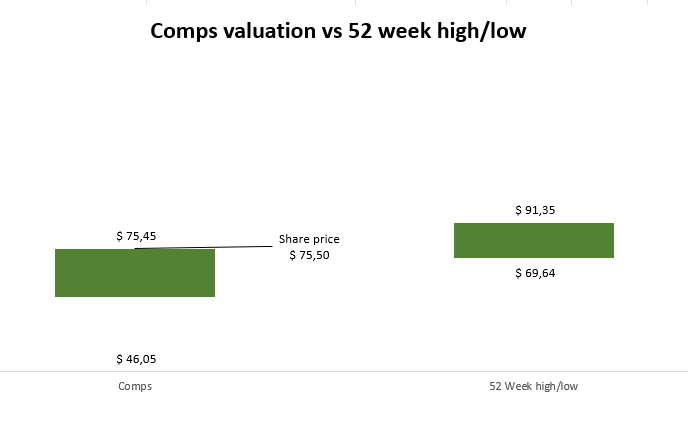
Figure 4: Comparative valuation analysis for NextEra Energy
First Solar, Inc. (FSLR)
First Solar is a global supplier of solar modules and a leader in solar technology. Advanced thin film photovoltaic (PV) modules made by the company are the most recent advancement in solar technology, offering a competitive, high-performance, and low-carbon substitute for traditional crystalline silicon PV panels.
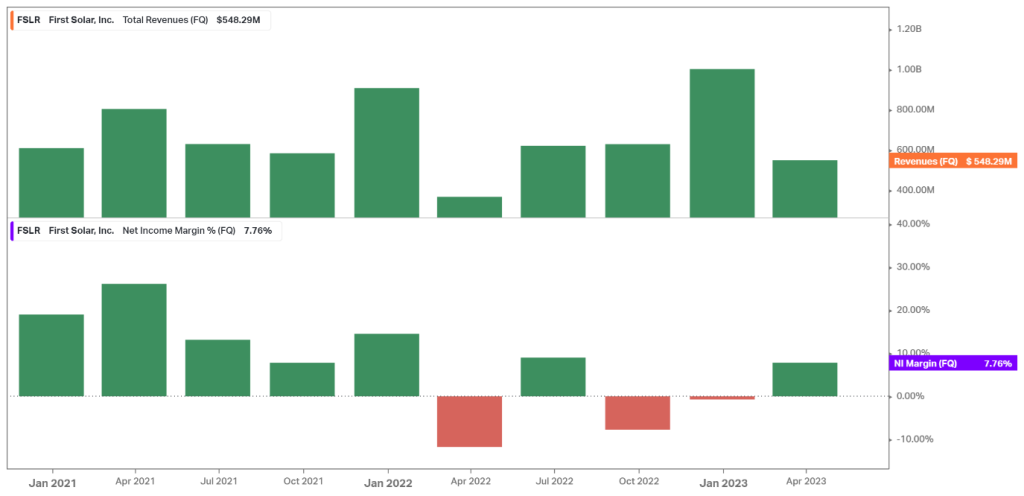
Figure 5: First Solar’s quarterly Total Revenue and Net Income margin performance
The company has been struggling to keep a consistently growing total revenue steadily quarter on quarter, bringing in $548.3 million in the first quarter of 2023. The business’s Net Income Margin was negative in the second half of 2022, and last quarter reached 7.8% in Q1. Ahead of Thursday’s release, analysts estimate that EPS will be one and revenue will be $722.21 million.
On an exciting note, according to US energy secretary Jennifer Granholm, First Solar will spend “hundreds of millions of dollars” to produce solar panels in India without using components from China.
Technical Analysis
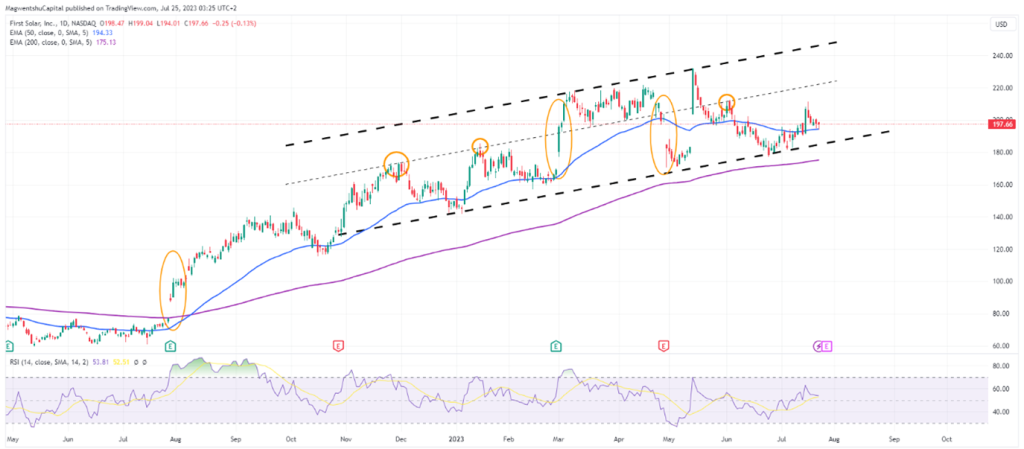
Figure 6: Daily chart from May 2022 for First Solar
The share price jumped from the previous resistance line of $80 on 28 July 2022. This is after the earnings results were released, and they beat both EPS and Revenue expectations by 243.89% and 1.12%, respectively. The RSI immediately jumped into overbought territory and stayed there until mid-September 2022. The share price has been on an upward trajectory ever since. There has been a clear bottom trend line of the upwards channel; however, there have been two lines for the top trend line.
The first trend line can be identified with the small orange circles after the share price tested it in December 2022, January 2023, and June 2023, respectively. The second trend line was formed after the share price jumped following the release of the financial results on 28 February 2023, where EPS beat expectations by 58.65%, and revenue aligned with expectations. The share price fell again in the following results after the company missed both the EPS and revenue expectations by 59.5% and 23.19%, respectively.
Comparative valuation
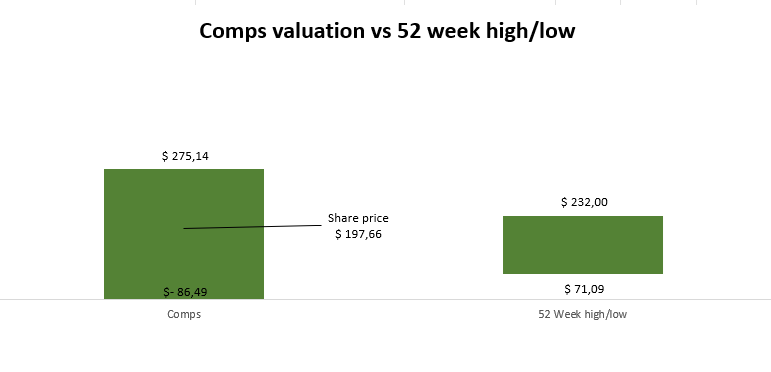
Figure 7:Comparative valuation analysis for First Solar
Enphase Energy (ENPH)
Global energy technology leader in microinverter-based solar and battery systems is Enphase Energy, a Fremont, California-based enterprise. The range of goods Enphase supplies to the European Solar Market continually diversifies. The 27 EU Member States connected 41.4 GW of new solar PV capacity to their grids in 2022, a 47% increase over 2021, according to a report by SolarPower Europe.
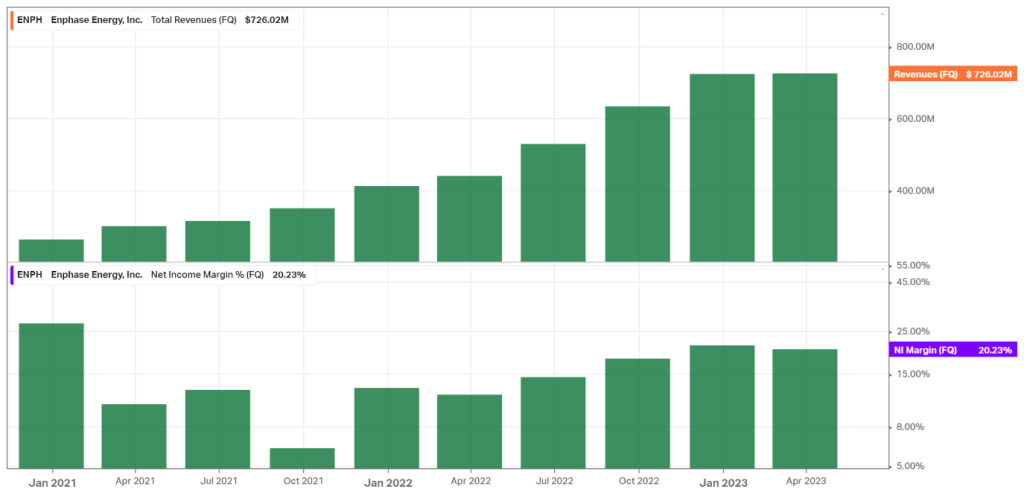
Figure 8: Enphase Energy’s quarterly Total Revenue and Net Income margin performance
Enphase has been experiencing a consistent, steady growth of total revenue of 78% in the financial year 2021 and 69% for the 2022 financial year. Ahead of Thursday’s release, analysts estimate that EPS will be 1.28 and revenue will be $725.83 million. Enphase experienced strong sales of microinverters in Europe in the first quarter of 2023. During the past two months, it expanded its relationship with Baywa r.e. to distribute in Poland and the Netherlands, Germany, Belgium, and Luxembourg. The company announced yesterday that LGCY Power, one of the fastest-growing residential solar installers in the United States, is expanding deployments of Enphase® Energy Systems. The Solar Power Europe’s report further estimates more than 50 GW deployment level in 2023 and more than double from 2022 to 85 GW in 2026.
Technical Analysis
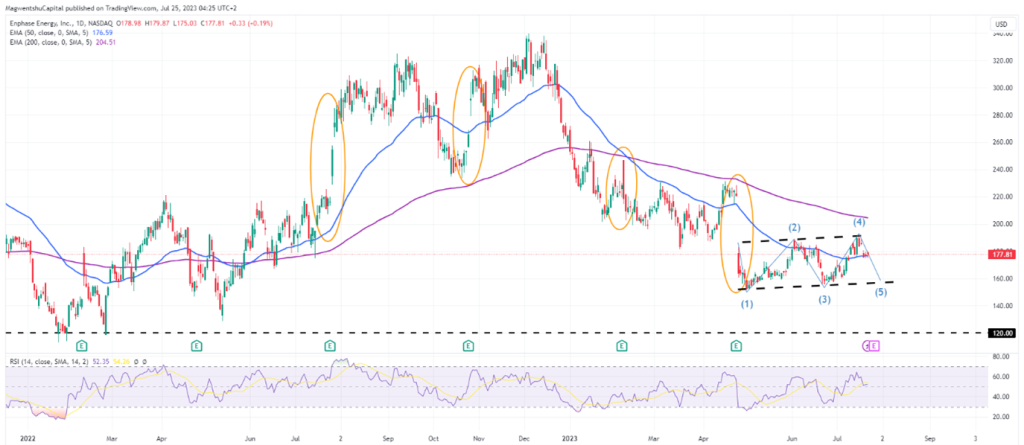
Figure 9: Daily chart from the beginning of 2022 for Enphase Energy
The current resistance line is $120 after the share price broke above this level in November 2020. The share price reached an all-time high of $339.92 in December 2022 but has declined since then. In the last four earnings results that the company has released, the share price has jumped both positively and negatively. The business has beaten Earnings per share and Revenue expectations in the same period.
In the last two earnings results, we observed some significant technical indicators. Following the February 2023 results, the 50-day exponential and 200-day moving averages formed a death cross. After that, upon the release of the April results, the share price gapped to the downside and has yet to fill the gap. The share price has formed a channel trending slightly toward the upside. On the side of the channel, we also note an Elliot Impulsive Wave forming, which is close to completion.
Comparative valuation
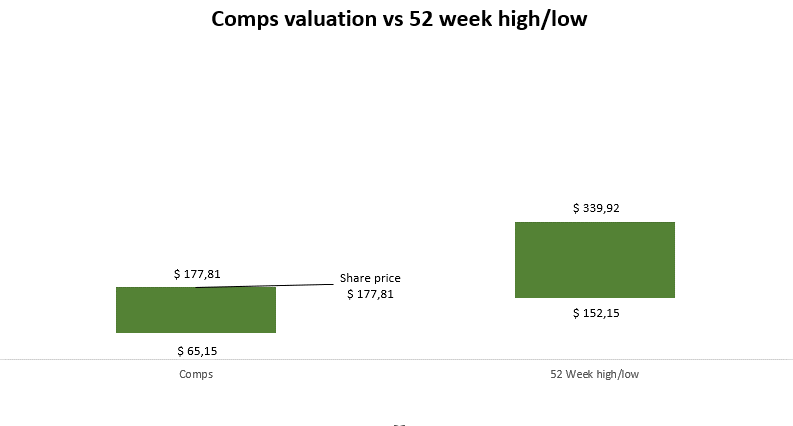
Figure 10:Comparative valuation analysis for Enphase Energy
Sources: The Economic Times; CNBC; Energy Portal; Trading View; Yahoo Finance; First Solar; Market Watch; Enphase; NextEra Energy; Seeking Alpha; and KoyFin.
Author: Odwa Magwentshu, FMVA
Disclaimer: Trive South Africa (Pty) Ltd, Registration number 2005/011130/07, and an Authorised Financial Services Provider in terms of the Financial Advisory and Intermediary Services Act 2002 (FSP No. 27231). Any analysis/data/opinion contained herein are for informational purposes only and should not be considered advice or a recommendation to invest in any security. The content herein was created using proprietary strategies based on parameters that may include price, time, economic events, liquidity, risk, and macro and cyclical analysis. Securities involve a degree of risk and are volatile instruments. Market and economic conditions are subject to sudden change, which may have a material impact on the outcome of financial instruments and may not be suitable for all investors. When trading or investing in securities or alternative products, the value of the product can increase or decrease meaning your investment can increase or decrease in value. Past performance is not an indication of future performance. Trive South Africa (Pty) Ltd, and its employees assume no liability for any loss or damage (direct, indirect, consequential, or inconsequential) that may be suffered from using or relying on the information contained herein. Please consider the risks involved before you trade or invest.