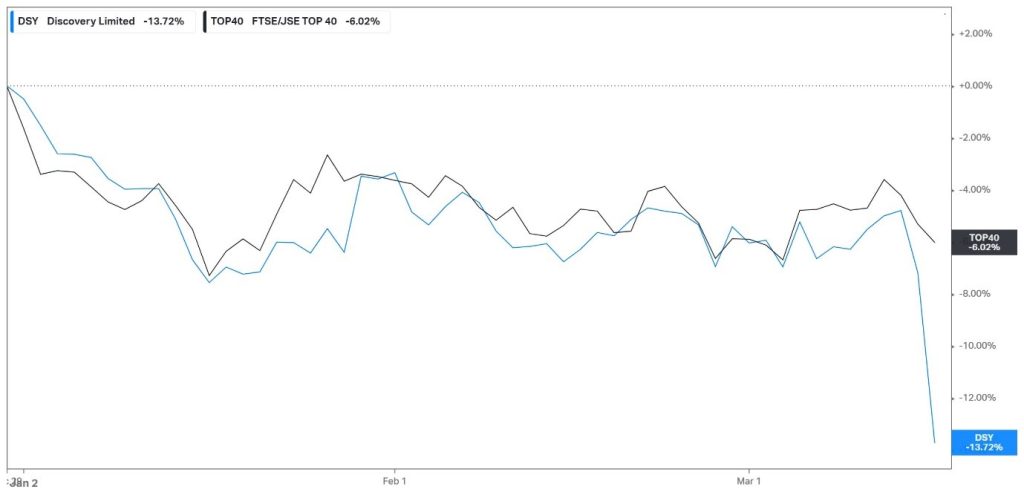
Discovery Ltd (JSE: DSY) has become a focal point for investors amidst significant fluctuations in its stock price, marking a stark contrast to its successful performance in 2023.
Despite achieving a robust 16% gain last year, the company’s shares have plummeted by 13% year-to-date, sparking concerns among stakeholders. In 2023, Discovery Group demonstrated resilience, delivering strong performances across key segments, driving substantial growth in premiums, revenue, and market value. Notably, total net income surged by an impressive 29% to R86.4 billion, fuelled by substantial gains in financial asset valuations and increased investment income, consequently leading to notable increases in operating profit and normalized headline earnings.
However, recent developments have injected uncertainty into Discovery’s trajectory. A voluntary trading statement released by the company indicated a potential variance in headline earnings and earnings per share, eliciting a negative market response. With the stock underperforming the JSE Top 40 Index twice over on a year-to-date basis, investor confidence in Discovery’s prospects has weakened significantly. As stakeholders await further insights from the company’s upcoming reports, the market eagerly seeks clarity on the factors driving the recent downturn and the potential implications for Discovery’s future performance.
Source: Trive – Koyfin, Nkosilathi Dube
Technical
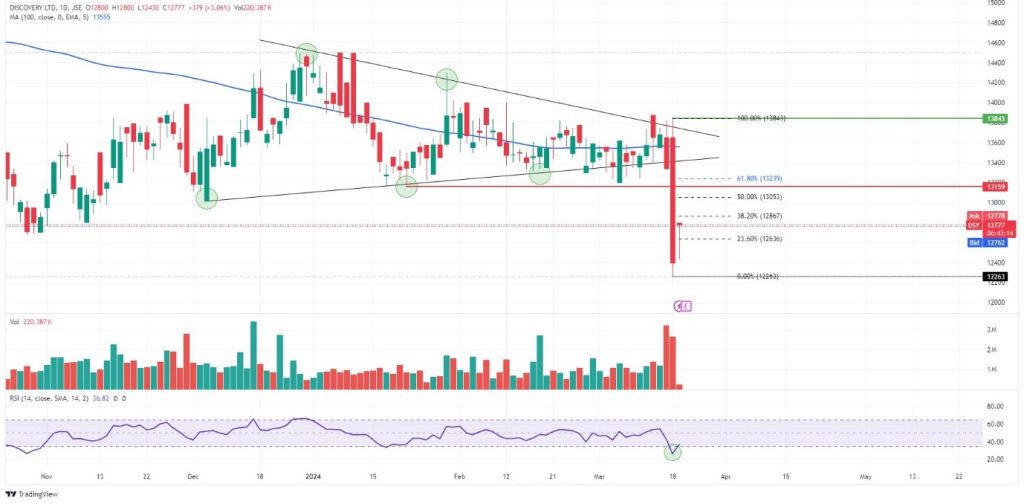
Discovery Ltd’s share price has experienced significant volatility, plunging below a one-year low amidst a pronounced downtrend. Now trading below the 100-day moving average, the stock initially displayed a symmetrical triangle pattern, suggesting a period of consolidation.
This equilibrium between bullish and bearish forces was marked by converging highs and lows, with support initially holding steady at R131.59 per share. However, mounting downside pressures led to a breakdown from the R138.43 resistance level, signalling the dominance of sellers. The breach of the R131.59 support level triggered a sharp selloff.
Yet, at R122.63 per share, selling pressures eased, resulting in a reversal and the establishment of a new support level amid oversold RSI conditions. If buyers enter the market attracted by potential bargains, a sustained reversal may occur, with R131.59 per share likely to serve as a key point of interest to the upside.
Fundamental
Discovery Ltd’s recent voluntary trading statement disclosed a range for expected headline earnings and earnings per share, suggesting potential variability in financial performance. Headline earnings are forecasted to fluctuate between 3% lower and 2% higher, while earnings per share are projected to range from 2% lower to 3% higher, indicating figures between R478.1 cents and R502.5 cents.
Despite this outlook, Discovery Group exhibited robust performance across its South Africa (SA), United Kingdom (UK), and Vitality Global (VG) segments during the 2023 financial year, driving substantial growth in premiums and revenue. Operating profit and normalized headline earnings also experienced significant increases, bolstering investor confidence.
Of particular note, Discovery Life’s operating profit surged by 19%, while the UK Life Business witnessed an impressive 55% increase, underscoring the strength of its business segments. Moreover, total net income soared by 29% to R86.4 billion, propelled by substantial gains in financial assets and increased investment income. Additionally, Discovery’s attractive dividend policy, highlighted by a final gross cash dividend of R1.10 announced last year, resonated well with dividend-seeking investors, further contributing to its positive share price performance.
As anticipation builds for Discovery’s upcoming half-year earnings report, stakeholders are eagerly awaiting to assess whether the company can maintain its positive trajectory amid evolving market dynamics and the disclosed earnings outlook.
Source: Trive – Koyfin, Nkosilathi Dube
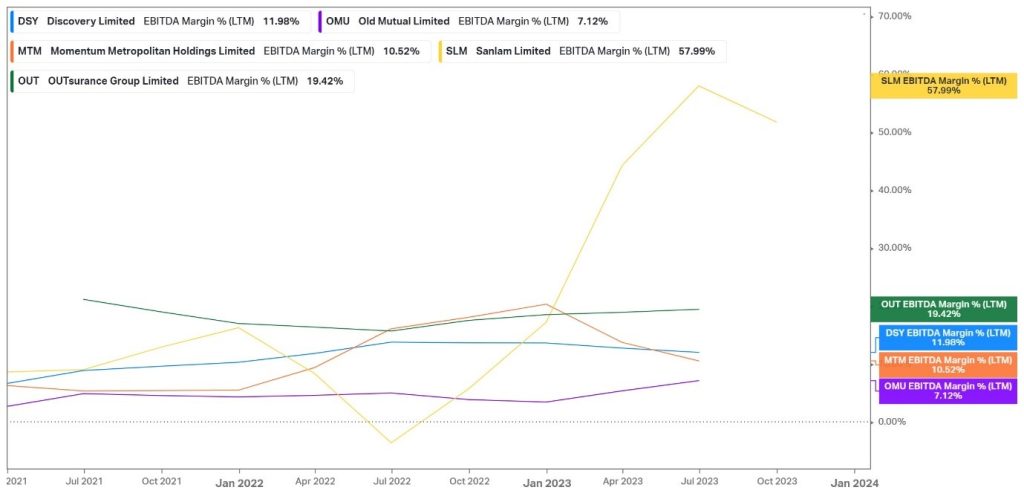
Discovery Ltd’s EBITDA margin stands at 11.98%, trailing behind the average of key competitors at 21.41%. Despite this, it remains positioned within the middle ground among its industry peers. Notably, Sanlam’s exceptional performance has contributed significantly to driving the sector’s average higher. This comparison underscores Discovery’s competitive positioning within the market, indicating room for potential improvement to narrow the gap with its rivals. As it continues to navigate the landscape, optimizing operational efficiencies may be crucial for enhancing profitability and maintaining competitiveness in the dynamic financial services sector.
Source: Trive – Koyfin, Nkosilathi Dube
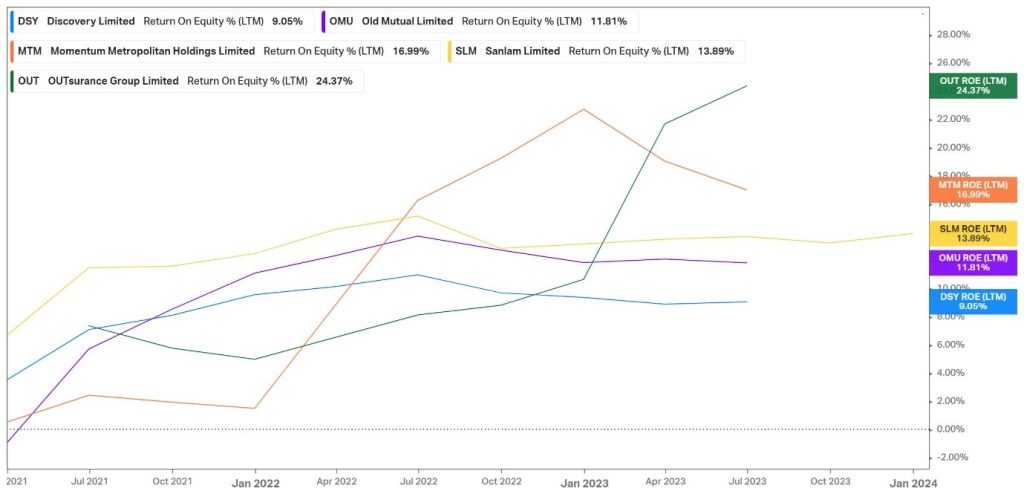
Discovery Ltd’s return on equity (ROE) stands at 9.05%, trailing behind the industry average of 15.22% among its key competitors. This discrepancy highlights a performance gap in generating returns for shareholders compared to its peers. Understanding ROE is vital as it indicates how efficiently a company utilizes shareholders’ equity to generate profits. While Discovery’s ROE is below the industry average, it signals an opportunity for the company to enhance its profitability and efficiency in utilizing equity. By improving operational performance and strategic initiatives, Discovery may aim to narrow the gap and align its returns more closely with industry benchmarks.

Source: Trive – Koyfin, Nkosilathi Dube
Discovery Ltd’s price-earnings ratio (P/E ratio) sits at 15.9×, positioning it at the upper end of its key competitors, whose average P/E ratio stands at 13.26×. The P/E ratio is a crucial metric used by investors to assess a stock’s valuation relative to its earnings. A higher P/E ratio suggests that investors are willing to pay more for each unit of earnings, indicating potential overvaluation. While Discovery’s P/E ratio exceeds the industry average, it may reflect market optimism and confidence in the company’s growth prospects.
Summary
Discovery Ltd faces challenges, with its stock price plummeting by 13% year-to-date despite robust performance in 2023. Technical analysis reveals a sharp downturn, trading below the 100-day moving average. Fundamentally, while it trails competitors in metrics like EBITDA margin and ROE, its higher P/E ratio hints at market confidence in growth potential.
Sources: Discovery Ltd, Reuters, Koyfin, TradingView
Piece Written By Nkosilathi Dube, Trive Financial Market Analyst
Disclaimer: Trive South Africa (Pty) Ltd (hereinafter referred to as “Trive SA”), with registration number 2005/011130/07, is an authorised Financial Services Provider in terms of the Financial Advisory and Intermediary Services Act, 37 of 2002. Trive SA is authorised and regulated by the South African Financial Sector Conduct Authority (FSCA) and holds FSP number 27231. Trive Financial Services Ltd (hereinafter referred to as “Trive MU”) holds an Investment Dealer (Full-Service Dealer, excluding Underwriting) Licence with licence number GB21026295 pursuant to section 29 of the Securities Act 2005, Rule 4 of the Securities Rules 2007, and the Financial Services Rules 2008. Trive MU is authorized and regulated by the Mauritius Financial Services Commission (FSC) and holds Global Business Licence number GB21026295 under Section 72(6) of the Financial Services Act. Trive SA and Trive MU are collectively known and referred to as “Trive Africa”.
Market and economic conditions are subject to sudden change which may have a material impact on the outcome of financial instruments and may not be suitable for all investors. Trive Africa and its employees assume no liability for any loss or damage (direct, indirect, consequential, or inconsequential) that may be suffered. Please consider the risks involved before you trade or invest. All trades on the Trive Africa platform are subject to the legal terms and conditions to which you agree to be bound. Brand Logos are owned by the respective companies and not by Trive Africa. The use of a company’s brand logo does not represent an endorsement of Trive Africa by the company, nor an endorsement of the company by Trive Africa, nor does it necessarily imply any contractual relationship. Images are for illustrative purposes only and past performance is not necessarily an indication of future performance. No services are offered to stateless persons, persons under the age of 18 years, persons and/or residents of sanctioned countries or any other jurisdiction where the distribution of leveraged instruments is prohibited, and citizens of any state or country where it may be against the law of that country to trade with a South African and/or Mauritius based company and/or where the services are not made available by Trive Africa to hold an account with us. In any case, above all, it is your responsibility to avoid contravening any legislation in the country from where you are at the time.
CFDs and other margin products are complex instruments and come with a high risk of losing money rapidly due to leverage. You should consider whether you understand how these products work and whether you can afford to take the high risk of losing your money. Professional clients can lose more than they deposit. See our full Risk Disclosure and Terms of Business for further details. Some or all of the services and products are not offered to citizens or residents of certain jurisdictions where international sanctions or local regulatory requirements restrict or prohibit them.