In a dazzling quarterly reveal, Netflix, Inc. (NASDAQ: NFLX) soared past all expectations, celebrating the triumphant results of its bold password-cracking strategy. With a skyrocketing influx of new subscribers and enticing enhancements to their subscription offerings, the company’s leadership has orchestrated a strategic masterclass. Captivated by their vision, investors eagerly subscribed to the growth story, driving a remarkable 16% surge in the company’s stock price.
Revenue for the quarter expanded from $7.93Bn in the same quarter last year to an attractive $8.53Bn, slipping past the $8.53Bn consensus. Similarly, its bottom line felt the effects, with earnings per share (EPS) picking up the pace from $3.10 to $3.73, easing past the $3.50 forecasts. The positive impact of its password-sharing crackdown was well met, as its subscriber numbers showed its best performance since the COVID-19 pandemic peak, showcasing a potential turnaround in Netflix’s strategic path.
Technical

On the 1W chart, an ascending channel showed signs of a potential breakdown before the share price surge, as the earnings release triggered a retracement. The share price is currently retesting the dynamic channel support close to the 25-SMA (green line). With support from the 50-SMA (blue line) and the 100-SMA (orange line), the price could attempt to move back within the channel towards the Fibonacci midpoint of $430.04.
If the breakdown point of the channel prevents additional upside, the share price could reverse some of the weekly gains below the multiple SMAs if the monetary conditions in the economy remain tight. This might establish support in the longer term at $320.67. Neckline support is established at $277.40 and $250.28, which could prevent additional selling pressure if the price reverses.
However, if the price moves above the $430.04 level, a breakout above the $454.35 resistance could result in the price testing the 61.8% Fibonacci golden ratio at $491.74. Convergence with the estimated fair value of $504.04 could occur above this level, which presents a 26% potential upside from the current price.
Fundamental
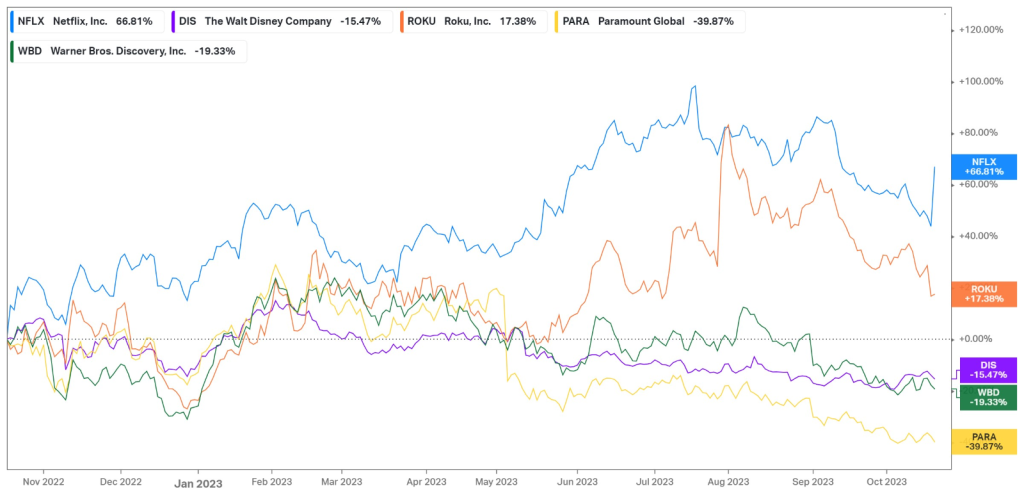
Over the last year, Netflix has returned over 66%, navigating multiple headwinds in the market. With interest rates and inflation remaining elevated, consumers’ pocksts have remained tight, and Netflix has accommodated for these developments by offering discounted prices on its ad-supported tiers. While cracking down on the use of one account per household, the company has managed to build its subscriber base at a record pace while offering cheaper ad-included alternatives to entice users who were sharing accounts to move over to their own subscriptions. As Netflix stays ahead of its competitors in terms of innovating its offerings to retain its customer base while extracting additional revenue per user, they have outperformed all of their competitors over the last year, showcasing their continued dominance in the industry.
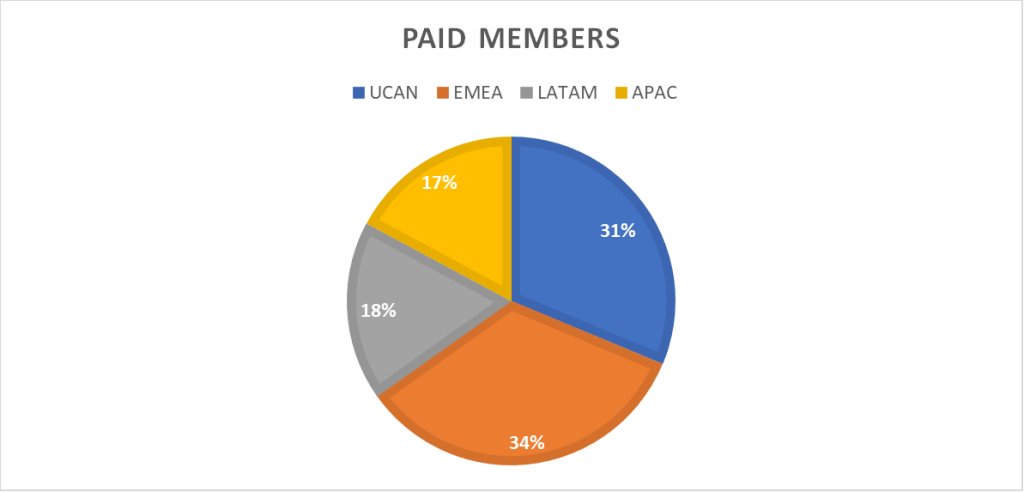
The breakdown of the company’s member composition is shown below, with the majority of paid members coming from the US, Canada, and the EMEA region. On the earnings report, the company also announced that it would hike its subscriber prices in the US, UK, and France, which would affect a large part of its subscriber base. In the US, its basic plan will now cost $11.99 per month, up $2 from the prior $9.99, while its premium plan will go from $19.99 to $22.99. Similar hikes in the UK will now see the basic plan costing £7.99, with the premium subscription costing £17.99. In France, the basic plan will cost €10.99, while the premium subscription will come with a monthly fee of €19.99. Considering the fact that Netflix added 8.8M net paid additions globally, up from the 2.4M additions in the prior period and the 6M consensus, this could unlock a lot of additional revenue if they can consistently retain the global subscriber base of 247.2M. In addition, its ad-supported tier, another strategic method to unlock additional revenue per user, has grown 70% quarter-on-quarter, suggesting that users are buying into the idea of moving over to their own subscriptions at a lower price.
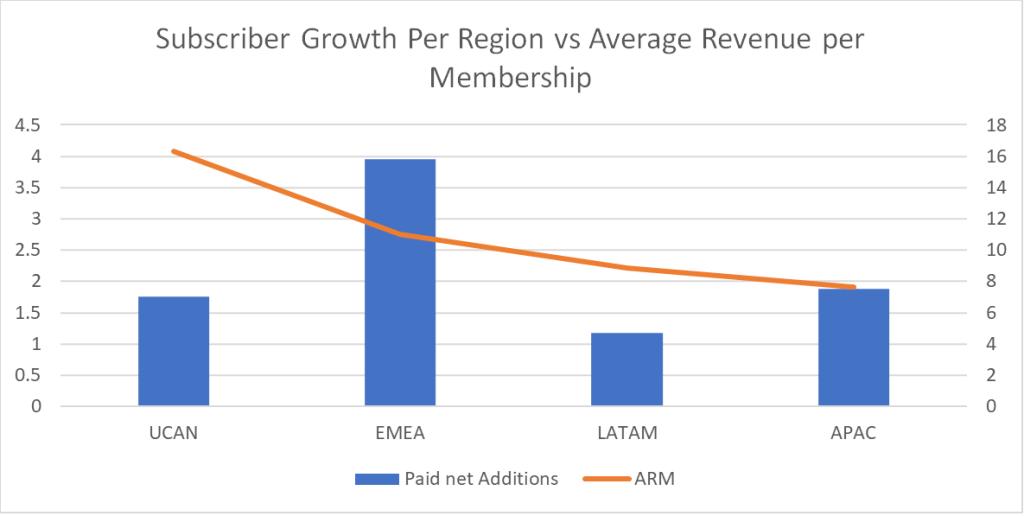
Regarding subscriber growth per region, the company added 3.95M subscribers in the EMEA region, with the US adding 1.75M subscribers. Its smallest paid net additions came from Latin America, with only 1.18M, while the Asian Pacific region added another 1.88M subscribers. However, when looking at the areas where the company generates its highest average revenue per membership, the US and Canada region leads the pack, with the EMEA region falling slightly behind. As a result, despite the EMEA holding the most subscribers, the company’s core revenue generator remains the US, which contributed $3.74Bn to the company’s top line in the latest quarter.
While its current strategic pivot seems to be paying off, and the share price has accelerated nicely over the last year, it is worth relooking at the risk profile of the company’s stock from a portfolio perspective. Compared to the benchmark of the broader Nasdaq 100 index, it becomes evident that Netflix has been highly volatile over the last ten years of trading. Its maximum drawdown of close to 76% accompanies an annualized standard deviation of over 48%, which is concerning against the Invesco QQQ Trust’s 17.71% annualized standard deviation at a maximum drawdown of 35.12%. However, this could be expected due to the diversification benefits of the funds, which is why it is worth looking at the risk-adjusted returns that these investments represent. Netflix does participate more in the market upswings, with an upside capture ratio of 165.32%. Still, the downside capture is a cause for concern at 102.91%, suggesting more downside risk to the market’s fluctuations. The company has also spent a lower percentage of months over the last ten years with positive returns, at only 61.24%, while contracting over 63% in the stress test during the inflation surge of 2022. Overall, while its 10-year return outshines the QQQ trust with a 23.74% expansion, its risk-adjusted returns, reflected in its Sharpe ratio, are lower, suggesting less return per unit of risk than the diversified QQQ fund. While these metrics present a picture of the company’s risk metrics, it is not directly comparable to a diversified fund and only serves as an approximation of the company’s risk compared to a diversified portfolio, as a reflection of what the company’s characteristics could add to the risk composition of a portfolio.
| Risk Metrics | Netflix | Invesco QQQ Trust |
| Maximum Drawdown | -75.95% | -35.12% |
| Upside Capture Ratio | 165.32% | 100% |
| Downside Capture Ratio | 102.91% | 100% |
| Total Capture Ratio | 1.61 | 1 |
| Positive Months (%) | 61.24% | 64.34% |
| Stress Test – Inflation Surge 3 January 2022 – 12 October 2022 | -63.03% | -34.29% |
| Standard Deviation (Annualized) | 48.58% | 17.71% |
| 10-Year Return | 23.74% | 16.94% |
| Risk-Adjusted Return (Sharpe Ratio) | 0.72 | 0.96 |
Summary
Netflix’s share price is soaring after reporting stellar earnings on the back of a successful strategic move to crack down on password sharing. If the price can break through the 25-SMA resistance on the 1W chart, convergence with its estimated fair value of $504.04 can occur, representing another 26% potential upside from current levels.
Sources: Koyfin, Tradingview, Reuters, Netflix, Inc.
Piece written by Tiaan van Aswegen, Trive Financial Market Analyst
Disclaimer: Trive South Africa (Pty) Ltd, Registration number 2005/011130/07, and an Authorised Financial Services Provider in terms of the Financial Advisory and Intermediary Services Act 2002 (FSP No. 27231). Any analysis/data/opinion contained herein are for informational purposes only and should not be considered advice or a recommendation to invest in any security. The content herein was created using proprietary strategies based on parameters that may include price, time, economic events, liquidity, risk, and macro and cyclical analysis. Securities involve a degree of risk and are volatile instruments. Market and economic conditions are subject to sudden change, which may have a material impact on the outcome of financial instruments and may not be suitable for all investors. When trading or investing in securities or alternative products, the value of the product can increase or decrease meaning your investment can increase or decrease in value. Past performance is not an indication of future performance. Trive South Africa (Pty) Ltd, and its employees assume no liability for any loss or damage (direct, indirect, consequential, or inconsequential) that may be suffered from using or relying on the information contained herein. Please consider the risks involved before you trade or invest.