
In the aftermath of a shocking third-quarter earnings showdown, Tesla, Inc (NASDAQ: TSLA) found itself riding a rollercoaster of woes. With CEO Elon Musk shifting gears from his ‘recession resilient’ tale to a more cautious narrative, the electric vehicle empire saw its stock take a nosedive by over 9%.
The company’s most formidable earnings mishap in over three years was an unexpected twist of fate brought about by the merciless grip of high-interest rates. Revenue for the quarter amounted to $23.35Bn, showing a 9% year-over-year expansion, but missed the market’s consensus of a $24.38Bn print. Its earnings per share (EPS) faltered by 37%, coming in at $0.66, a sharp miss from the $0.73 forecast. Tesla was compelled to execute a jolt of price reductions on its beloved electric vehicles, all in a bid to stimulate demand, but this electrifying manoeuvre ate into their profit margins, leaving investors feeling somewhat shocked.
Adding fuel to the fire was Musk, whose commentary resembled a pit stop caution flag. He announced the plan to delay the scheduled expansion of Tesla’s Mexican factory, choosing not to put his foot on the accelerator during this period of uncertainty. After these earnings, the question has arisen: Is Tesla’s pole position as the electric vehicle pioneer beginning to lose its charge?
Technical
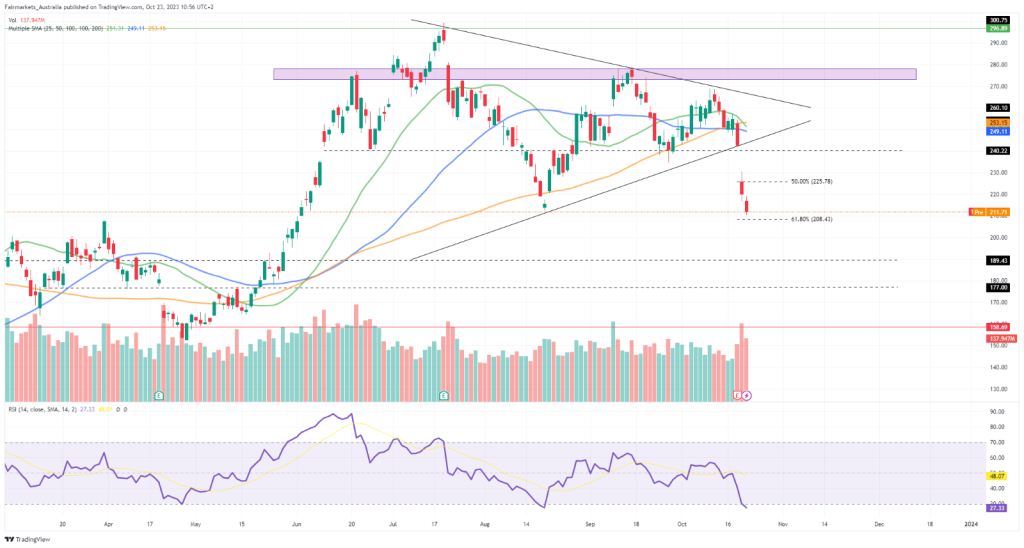
On the 1D chart, the earnings reaction saw a sustained breakdown of the symmetrical triangle formation, potentially charting the course for the price action as we advance. The 100-SMA (orange line) has crossed above the 50-SMA (blue line) and the 25-SMA (green line), confirming the presence of selling momentum.
However, from the mid-July peak, the share price has retraced past the Fibonacci midpoint of $225.78, where it could now seek support at the 61.8% golden ratio of $208.43. If the current pullback persists, lower support at $189.43 and $177.00 could come under the spotlight, as the fundamental environment that strains the company’s performance is likely to persist over the next quarter.
However, with the RSI indicating oversold conditions, a technical correction could see the price pivot off the $208.43 level to potentially retest the breakdown point of the triangle at $240.22. A previous supply zone close to $277.85 poses a challenging barrier for the share price to breach in the current conditions. However, on a discounted cash flow basis, the company’s estimated fair value of $296.89 still presents some meaningful upside, with the recent pullback potentially widening the convergence margin for the longer-term play.
Fundamental
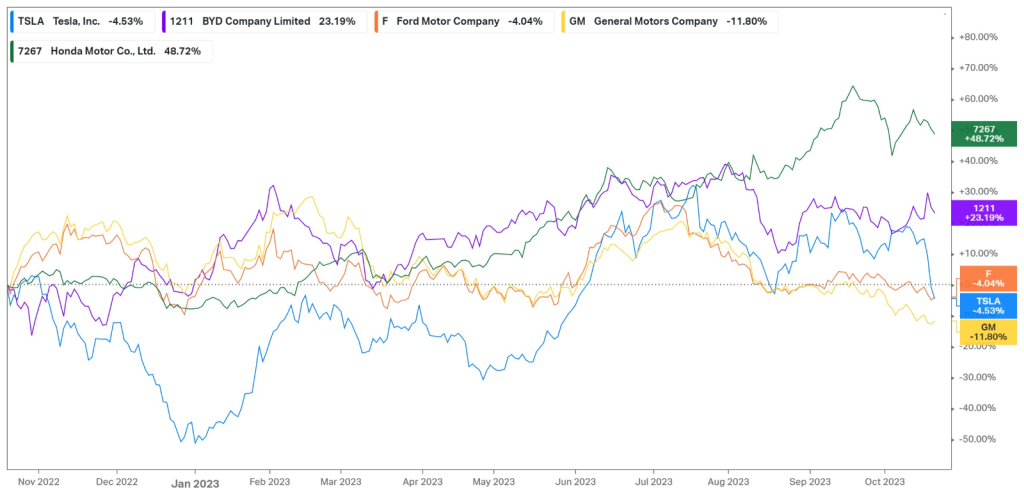
Over the last year, Tesla’s share price has contracted by almost 5% as it weathered unfavourable economic developments in its operations. Increasing borrowing costs are weighing on the affordability of its iconic electric vehicles, forcing management to engage in aggressive price cuts, which triggered a pricing war with many of its competitors. More affordable options like Honda have benefitted from this environment, advancing 48.72% over the last year, while the biggest threat to Tesla’s global reach remains BYD, which has appreciated over 23% in the same period, as it continues to eat into Tesla’s market share, particularly in China. As the company’s share price loses value, could this open up a lucrative opportunity for a long-term play?
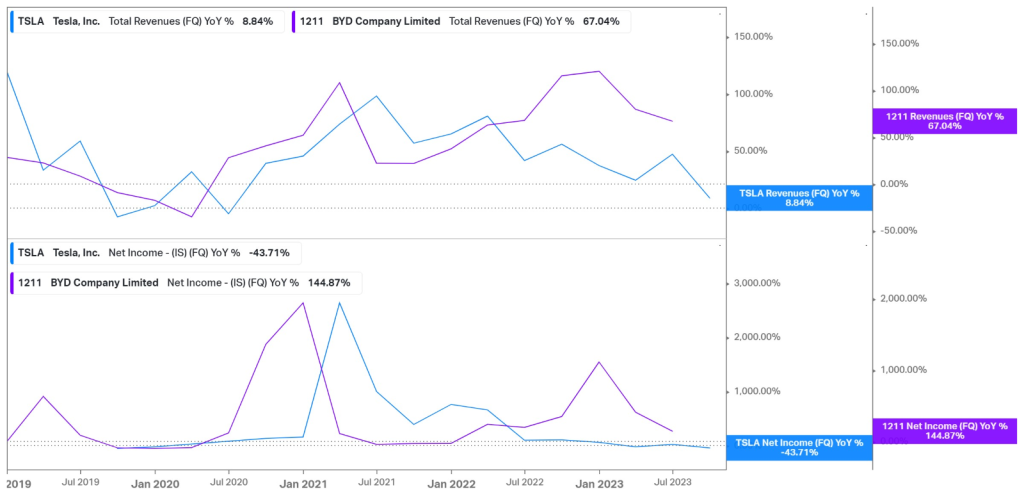
The concerning factor is Tesla’s lack of progress in growing its numbers compared to its competitors. While its revenue growth ticked up close to 9% in the latest quarter, it shows a massive growth slowdown from the rate at which it was able to expand a few years back. Its auto segment, in particular, is a victim of this slowdown, growing by a mere 5% to $19.63Bn in the latest quarter. On the bright side, its energy generation and storage revenue expanded by 40% to $1.56Bn, while services and other revenue showed a similar 32% growth toward $2.17Bn. However, these businesses contribute a very small percentage to the company’s top line, and even its fastest-growing enterprises are not even touching the 67.04% year-over-year growth that BYD managed in its latest quarterly report, as shown in the graph below. The bottom line paints a similar picture, with Tesla’s net income growth falling to a worrisome -44%, with its biggest competitor managing to grow profitability by over 144%.
The challenging demand environment is reflected in its delivery numbers. Deliveries fell to 435,039 in the third quarter, a marked contraction from the 466,140 deliveries in the second quarter of the fiscal year. This number fell short of analyst projections of 455,000, with its Model 3/Y deliveries coming in at 419,074, compared to the 15,985 deliveries in its Model S/X vehicles. Similarly, its production took a tumble, falling from 479,700 in the second quarter to 430,488, amid recent factory upgrades and the company’s efforts to reduce its inventory.
As its deliveries continue to feel strain, Tesla has engaged in multiple price cuts over the year to re-stimulate demand for its vehicles despite the high borrowing costs. In September, Tesla sharply reduced the prices of its Model S/X vehicles in the US and China, making the Model X eligible for the $7,500 federal tax credit. It also slashed the prices of its full self-driving (FSD) software from $15,000 to $12,000. Furthermore, in early October, Tesla engaged in further price cuts in its Model Y and Model 3 vehicles, shortly after introducing a lower range Model Y for $3,750 cheaper than its prior base model. In order to meet its annual 1.8M vehicle delivery targets, the company is expected to continue cutting its prices to inject some volume into its operations.
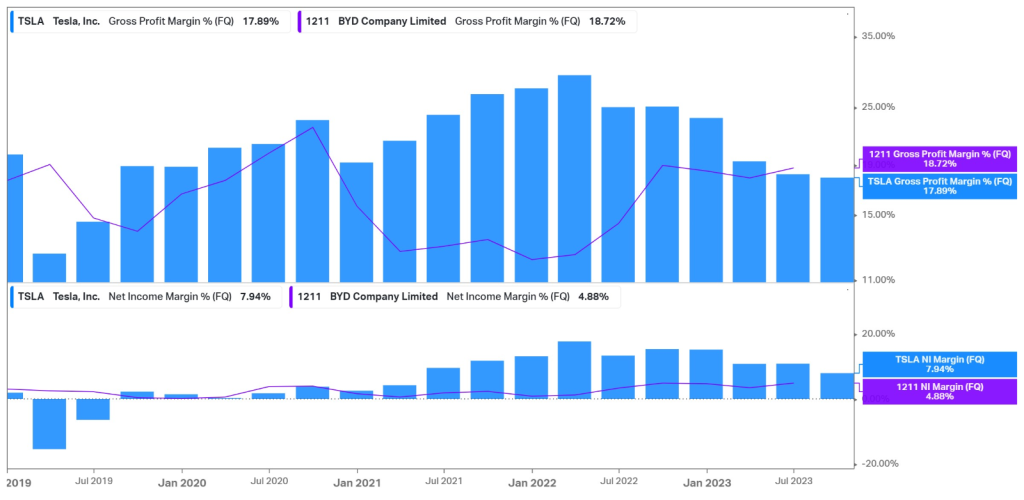
However, these price cuts are deteriorating the company’s margins. The graph below reveals the downtrend of its gross margin over recent quarters, with the third quarter of 2023 in particular showing a sharp contraction from 25.1% to 17.9%. Its operating margin fell from 17.2% to 7.6%, while its net income margin fell from a height of around 20% to a mere 7.94%. Its gross margin is on an entirely different trajectory than BYD, which has historically operated at lower margins than Tesla but recently tipped higher, with an 18.72% gross margin. If this trend persists, it could also overtake Tesla in terms of net income margin in the quarters to come.
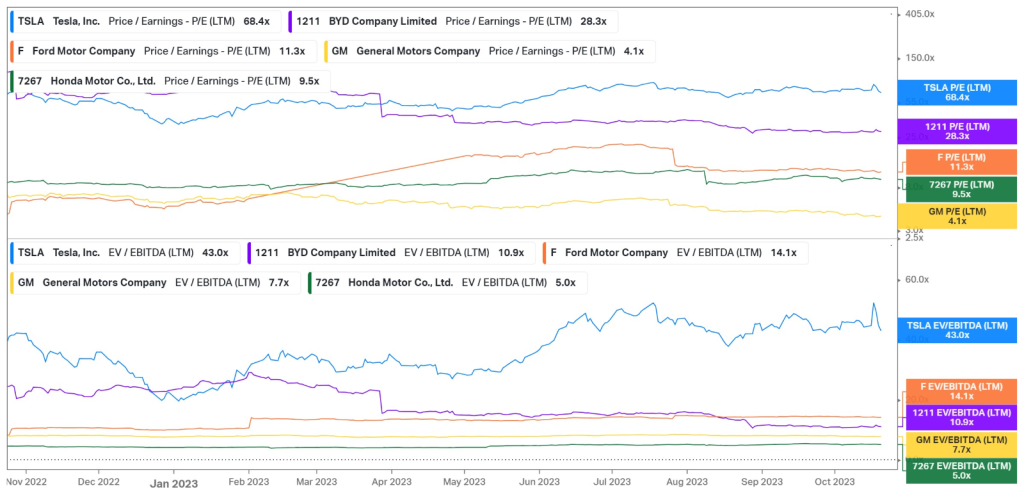
Adding to the uncertainty around the stock is its high valuation, despite the recent contraction in share price, as its profitability continues to decline. Investors placed a high premium on the company’s growth prospects, with a lot of optimism around the highly anticipated launch of its Cybertruck later this year. While its launch is scheduled for the 30th of November, Elon Musk struck a concerning tone, suggesting that the Cybertruck could take 12-18 months to significantly contribute to the company’s cash flows and suggesting that Tesla “dug their own grave”, placing a lot of uncertainty around the anticipated ramp-up in production. With a P/E of 68.4X still trading twice as high as its closest competitor and the EV/EBITDA multiple of 43X being three times as high as its peers, the company’s valuation seems to remain quite stretched, trading at a premium relative to its competitors.
Summary
After Tesla’s latest earnings report, investors have unsurprisingly acted risk-averse as the share price took a dive. With the company’s price cuts eating into its margins, the top-line growth is not convincing investors of its future growth prospects. However, with the estimated fair value of $296.89, the company’s share price still offers a lucrative potential upside if Elon Musk and his management team can find a way to change their fortunes in an uncertain economic backdrop.
Sources: Koyfin, Tradingview, Reuters, TheStreet, Investor’s Business Daily, Tesla, Inc.
Piece written by Tiaan van Aswegen, Trive Financial Market Analyst
Disclaimer: Trive South Africa (Pty) Ltd, Registration number 2005/011130/07, and an Authorised Financial Services Provider in terms of the Financial Advisory and Intermediary Services Act 2002 (FSP No. 27231). Any analysis/data/opinion contained herein are for informational purposes only and should not be considered advice or a recommendation to invest in any security. The content herein was created using proprietary strategies based on parameters that may include price, time, economic events, liquidity, risk, and macro and cyclical analysis. Securities involve a degree of risk and are volatile instruments. Market and economic conditions are subject to sudden change, which may have a material impact on the outcome of financial instruments and may not be suitable for all investors. When trading or investing in securities or alternative products, the value of the product can increase or decrease meaning your investment can increase or decrease in value. Past performance is not an indication of future performance. Trive South Africa (Pty) Ltd, and its employees assume no liability for any loss or damage (direct, indirect, consequential, or inconsequential) that may be suffered from using or relying on the information contained herein. Please consider the risks involved before you trade or invest.