
South African consumers are waiting with bated breath for the upcoming Consumer Price Index, which is expected on Wednesday at 10 am. Economic data released last week has indicated that the retail consumer is spending on looking dapper or gorgeous. We have looked into the three clothing retail stocks to the JSE and the latest economic data.
Technical
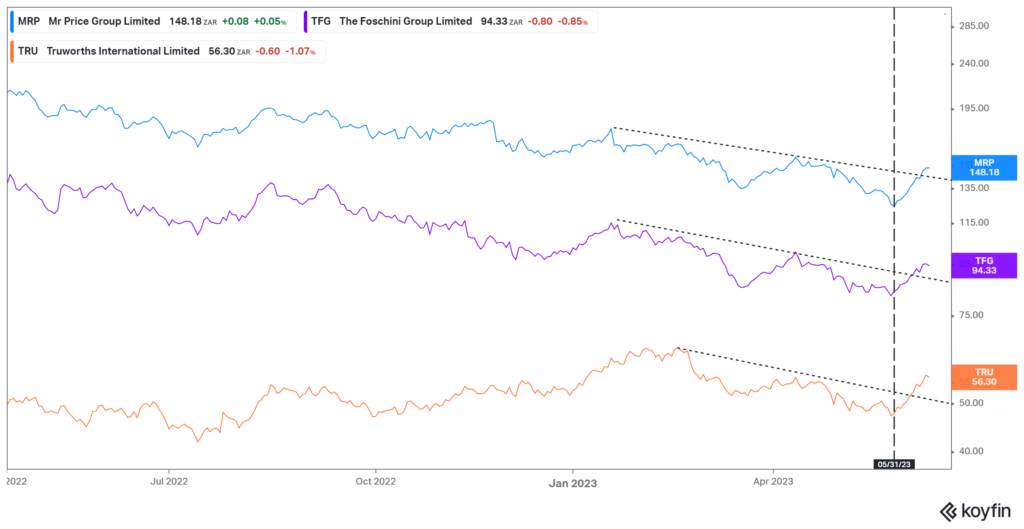
Figure 1: Comparison between Mr Price, TFG, and Truworths’ line chart since April 2022
As seen on the chart above, all three of the stock have changed momentum from their lows on the 1st of June 2023. Furthermore, as of the week of the 12th to the 15th of June 2023, clothing retailers have been trading above the trend line, and the momentum continues into this week.
From the beginning of June, all three companies bounced off lows which were last tested more than a year prior. Year to Date, of the three clothing retailers, Truworths International Limited has been the only company with favourable price action at 3.88%, whilst the remaining two are down by approximately 10%. The industry came to our attention last week after a positive performance in the stock market and Mr Price Group Limited leading the pack with a weekly performance of 5.09%. Truworths International Limited and The Foschini Group Limited were not far behind, with a weekly performance of 4.28% and 3.09%, respectively.
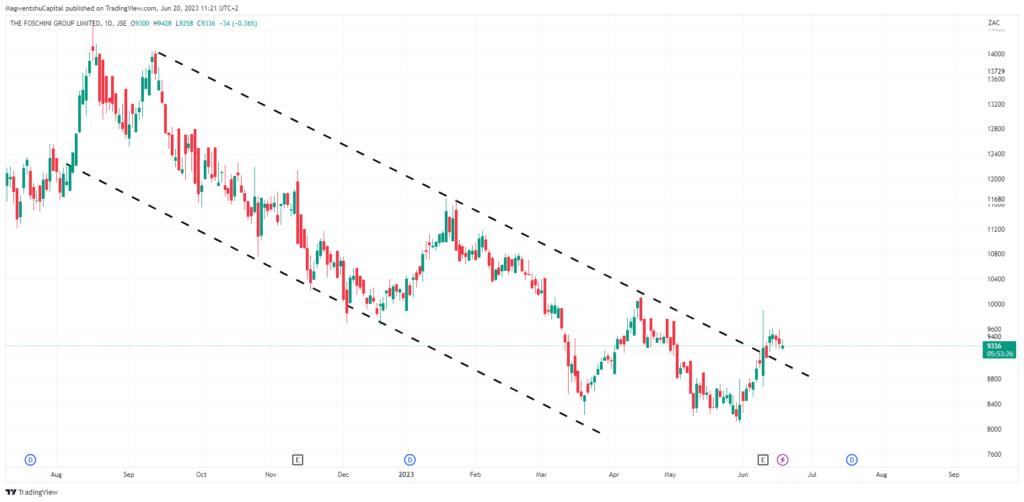
Figure 2:The Foschini Group Limited daily candle stick chart
As seen in the technical analysis above for The Foschini Group Limited’s daily chart, the price action has rebounded from the lows last traded in September 2020. The charting pattern is a breakout of a downward trend towards the upside, and if the pattern plays out, the share price could reach a take profit of nearly R120. The internal team previously covered the price action on this link.
Fundamentals
Macroeconomics
Household debt to income has dropped over the past ten years and decreased from 66.1% in 2021 to 62.6% in 2022, to the lowest point in the last ten years. The rule of thumb is that a good ratio is 35% or less, making it still a long way to go for the average South African. Interestingly enough, the local Household Debt to GDP has been oscillating between 34.1% and 34.2% in 2022, from a peak of 36.7% in 2021. This indicates a decline in the household debt of the consumer, and ever since 2020, the South African household saving ratio has been positive, with a declining trend.
Households have been struggling to stay afloat, and as of the 1st of March 2024, two pot system legislation, announced last week by the National Treasury, has allowed the public to comment until the 15th of July. The legislation will allow workers to access one-third of their retirement funds before they reach retirement saving throughout their careers.
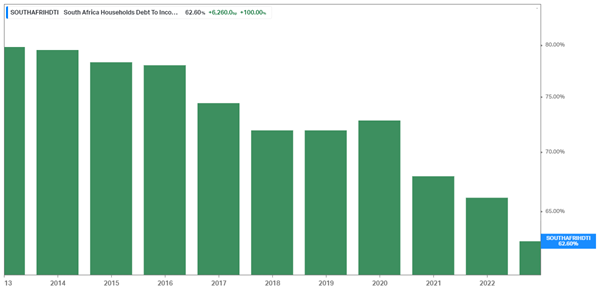
Figure 3: South Africa Household Debt to Income Ratio
The household savings ratio has been declining to interest-bearing debt with the interest rate hikes by the Monetary Policy Committee at the South African Reserve Bank.
Last week the retail trade sales numbers came out negative by 1.6% year on year. However, it is interesting to note that one of the positive contributors was textiles, clothing, footwear, and leather goods. This type of retailer has a weighting of 16.5% on the overall kind of retailer. The sector contributed 0.8 of the percentage point.

Figure 4: South Africa Retail Sales YoY
South African CPI
Analyst consensus is very optimistic for the upcoming CPI print on Wednesday at 10 am and has forecasted that the inflation rate will be announced to be 6%. This would continue the momentum of great macro news for the country as we have observed a strengthening currency over the past week following our near miss of a recession. If true, this would bring the inflation rate in the target range for the MPC of the SARB of 6% and could see the country follow the United States with a pause to the increase of interest rates in July.
Previous Results
The companies have been hurt by the ongoing interest rate hikes and rising inflation rates post-Covid, just like the rest of the country. The macroeconomics are becoming more favourable for the consumer, and as stated above, the consumer can now spend on clothes and so on.
In this challenging environment, we have focused on the company’s ability to generate a profit as a percentage of the revenue with the net income margin. The net income margin for Truworths International Limited has been growing steadily and was up 17.06% in the latest annual results. The same can be said for The Foschini Group Limited, following negative growth of 5.65% in the 2021 financial results and growing by 6.71% in 2022. Lastly, Mr Price Group Limited has consistently increased its net Income margin by approximately 12%.
Comparative valuation
We have compiled a comparative valuation for the three companies using EV/Revenue, EV/EBIT, and P/E ratios, and the figures show the price target range of the comparatives against the individual company’s 52-week high/lows.
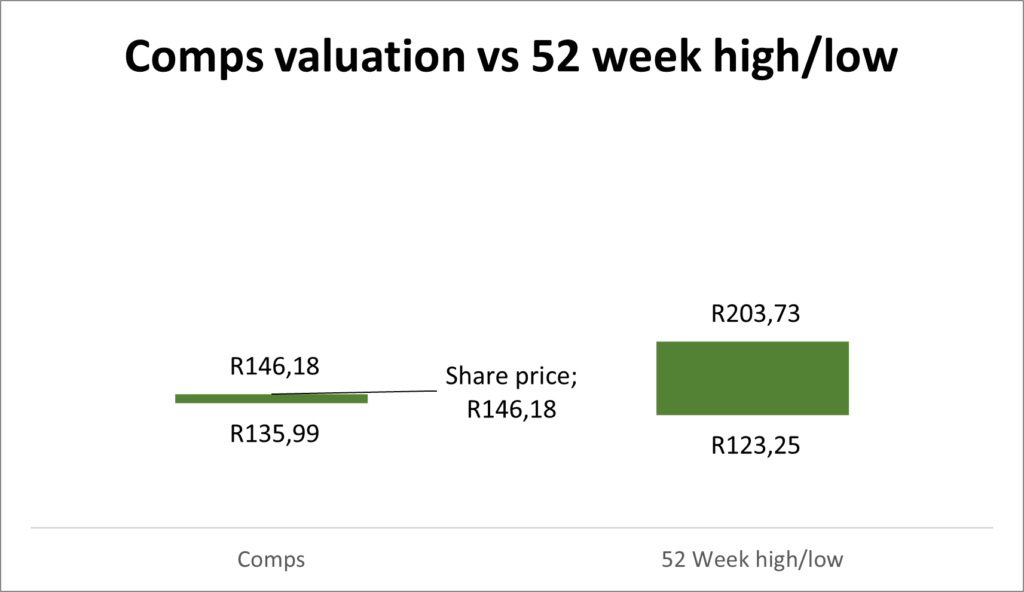
Figure 5: Mr Price Group Limited’s comparative valuation vs 12 months high/low
The comparative valuation for Mr Price Group Limited gives little leg way on the upside or downside. The company is also on the lower end of the price action over the past 12 months.
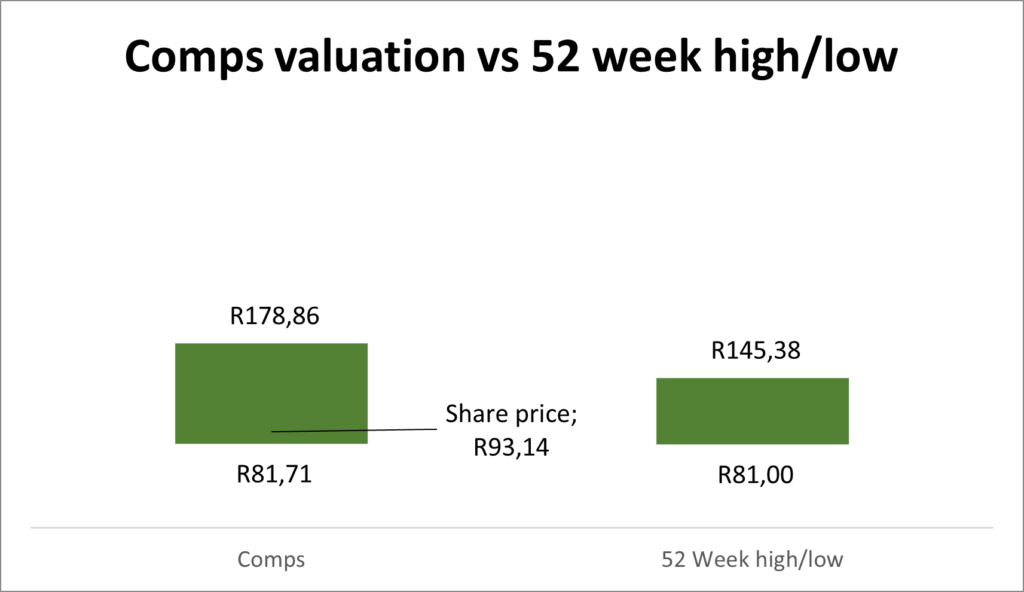
Figure 6:The Foschini Group Limited comparative valuation vs 12-month high/low
The comparative valuation for The Foschini Group Limited has a potential upside of nearly two times thanks to the EV/Revenue valuation of the company.
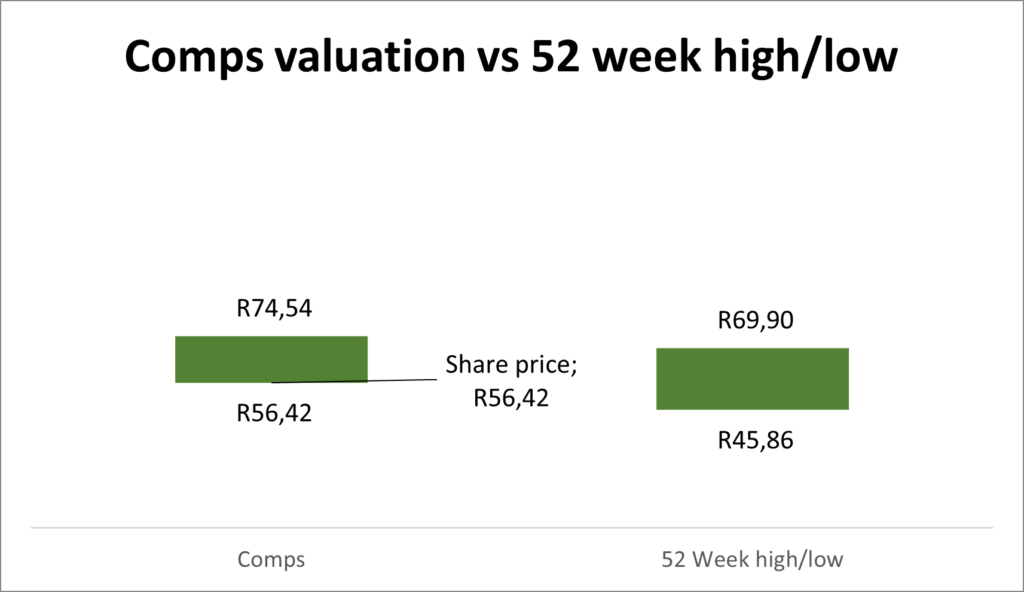
Figure 7:Truworths International Limited comparative valuation vs 12 months high/ low
The comparative valuation for Truworths International Limited has a potential upside thanks to the P/E ratio valuation of the company.
Summary
With both the technical analysis and the changing macroeconomics, clothing retailers are gaining momentum as consumers may only need to tighten their belts for a bit longer.[BD5] The nail in the coffin will be tomorrow’s inflation rate numbers coming in at the estimated 6% or better, indicating better times. The comparative valuation has also indicated potential upside with Truworths International Limited and The Foschini Group Limited.
Sources: MoneyWeb, KoyFin, Trading View, and Trading Economics
Disclaimer: Trive South Africa (Pty) Ltd, Registration number 2005/011130/07, and an Authorised Financial Services Provider in terms of the Financial Advisory and Intermediary Services Act 2002 (FSP No. 27231). Any analysis/data/opinion contained herein are for informational purposes only and should not be considered advice or a recommendation to invest in any security. The content herein was created using proprietary strategies based on parameters that may include price, time, economic events, liquidity, risk, and macro and cyclical analysis. Securities involve a degree of risk and are volatile instruments. Market and economic conditions are subject to sudden change, which may have a material impact on the outcome of financial instruments and may not be suitable for all investors. When trading or investing in securities or alternative products, the value of the product can increase or decrease meaning your investment can increase or decrease in value. Past performance is not an indication of future performance. Trive South Africa (Pty) Ltd, and its employees assume no liability for any loss or damage (direct, indirect, consequential, or inconsequential) that may be suffered from using or relying on the information contained herein. Please consider the risks involved before you trade or invest.