As Sasol Limited (JSE: SOL) prepares to unveil its Q1 2024 business performance results in the upcoming week, it’s an opportune moment to delve into its fiscal year 2023 financial report. This year witnessed a whirlwind of challenges, including oil price fluctuations, escalating inflation, softened energy demand, and underwhelming performance from state-owned entities. These hurdles, combined with socio-economic concerns and a globally unstable economic landscape, culminated in a substantial 78% reduction in earnings per share (EPS), plummeting from a noteworthy R62.34 to a modest R14.00.
The earnings report was clouded by an R34Bn impairment charge on its Secunda operations, which suffered due to the higher interest rate environment and future production implications of emission reduction costs. As a result, the company’s earnings before interest and tax (EBIT) slumped by 65% to R21.52Bn, despite its top line advancing by 6% to R289.69Bn. Earnings attributable to its shareholders contracted from R38.96Bn to a mere R8.8Bn, rounding off a challenging financial year. However, with tensions flaring in the Middle East, the oil price has made moves once more as Iranian supply concerns linger, which could aid Sasol’s performance in the first half of its new financial year.
Technical
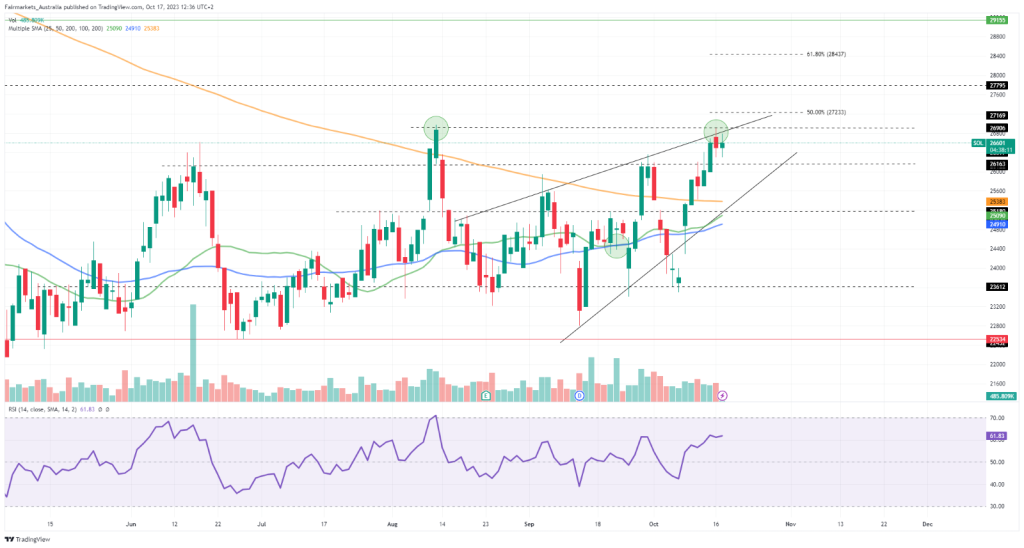
On the 1D chart, a rising wedge has formed, with the momentum being relatively neutral in recent weeks, confirmed by the tight range between the 25-SMA (green line) and the 50-SMA (blue line). However, the wedge’s dynamic resistance prevents additional upside at the same level that caused a reversal at R269.06, keeping a potential wedge breakdown in play.
If the resistance at this level holds sustainably, support at R261.63 could be the last line of defence against the wedge breakdown, which could send the price tumbling toward R251.80 and R236.12. Neckline support is established at R225.34 if the breakdown persists, which could provide some buying momentum in the longer term.
However, if the resistance at R269.06 fails to hold, the Fibonacci midpoint at R272.33 could be the first potential resistance level to the upside as the price moves out of the wedge. Resistance at R277.95 and the 61.8% Fibonacci golden ratio at R284.37 could then come into play on the share price’s journey to convergence with its estimated fair value of R299.55, presenting a 12.6% potential upside from the current level.
Fundamental
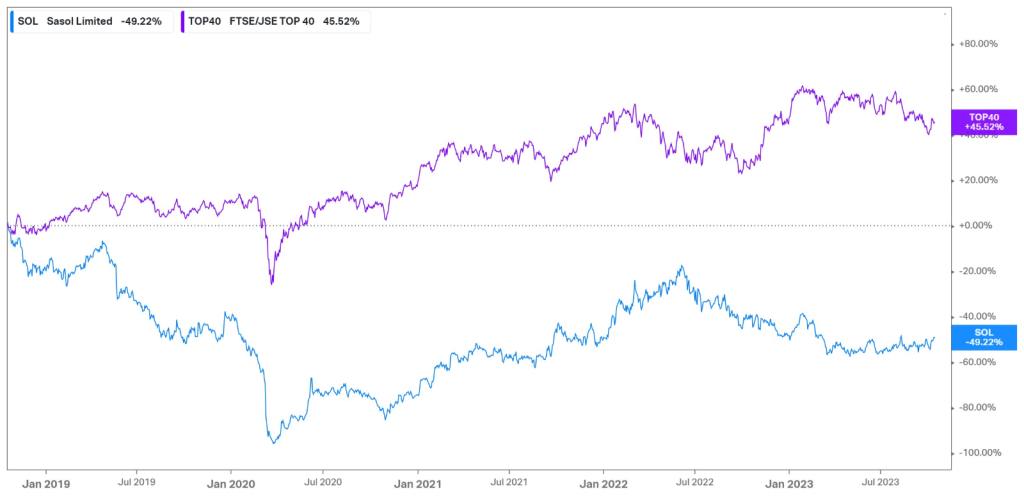
Over the past five years, Sasol has lost 49.22% of its value due to a share price contraction, falling way behind the JSE Top 40, which returned 45.52% over the same period. These five years were characterized by the fundamental shift during COVID-19, where crude oil and petrochemical prices were tumbling. Sasol approached near bankruptcy and halted dividend payments to its shareholders before the company swiftly recovered as the market returned to normality. Over the last six months, the company has appreciated by 8.49%, but the volatile oil market continues to cast uncertainty over the company’s future operations and could set up a mixed environment for the year ahead.
The company’s top and bottom line performance over the last few years is demonstrated in the graph below. The 2020 financial year shows a sharp loss in its operations, which forced the company to halt payments to its shareholders. However, its top-line performance has risen impressively since then, and while higher inflation has trickled over into increasing operational expenditures, the company has returned to profitability and reinstated its dividend last year.
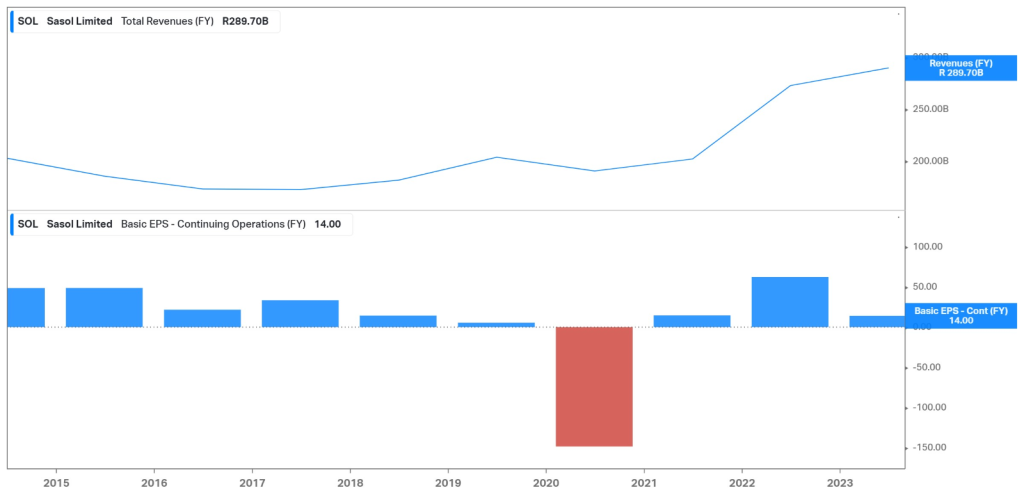
In the latest financial year, its turnover grew from R272.5Bn to R289.7Bn, as income from the fuel business offset the lower contribution from its American and Eurasian chemical businesses. The chart below shows the composition of this turnover, with its fuel business contributing R116.24Bn, or 40%, to its top line, up from R97.99Bn the year before. Its African Chemical business was its second largest revenue generator at R67.77Bn, up slightly from R64.05Bn in 2022, followed by Eurasia and America, which generated a turnover of R47.58Bn and R44.49Bn, respectively. Its fuel business also benefitted from higher rand oil prices, which contributed to a 5% increase in adjusted EBITDA, despite the lower refining margins in that business. However, its chemical business struggled on the bottom line, with its African chemicals segment suffering a 10% adjusted EBITDA contraction due to supply chain constraints and lower $/ton sales prices. Chemicals America’s adjusted EBITDA was down 96% due to lower sales prices and operational outages in the first half of the year, while its Eurasian business contracted by 74% on the bottom line, as lower demand and margins combined with reduced operating rates weighed on its performance.

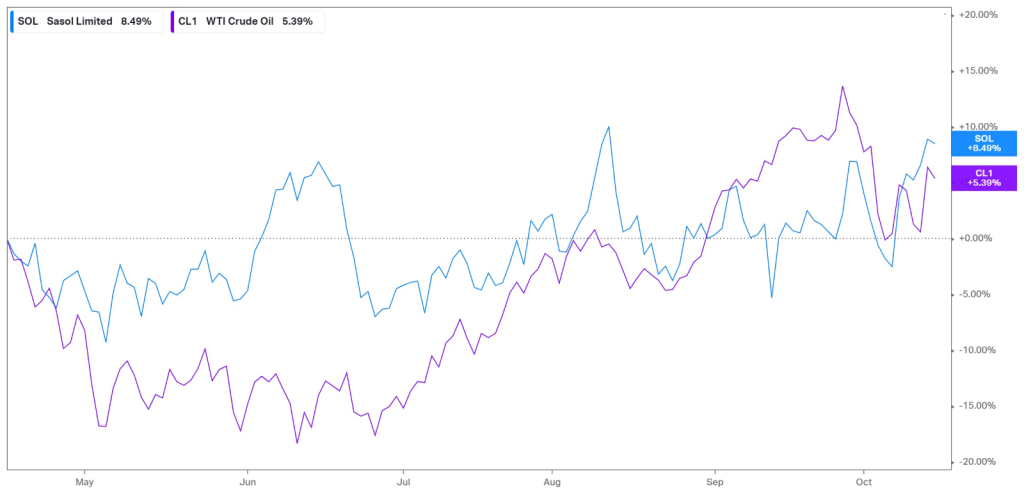
With fuel being its largest revenue contributor, it is worth tracking the performance of oil and its outlook for the upcoming quarter. Over the last six months, the WTI futures have advanced by 5.39%, with Sasol’s share price following suit with an 8.49% appreciation. Tensions in the Middle East have caused concern as the risk of the war spreading to key oil producers like Iran paints an uncertain supply environment, which currently underpins rising prices. Further optimism that the Federal Reserve may be done with its current hiking cycle could boost the oil demand and contribute to the recovery of petrochemical prices in the upcoming months.
Summary
While large impairments and declining chemical basket prices contributed to the slump in earnings in Sasol’s latest earnings report, a slight improvement in the oil market could act as a tailwind for the upcoming quarters. Its first-quarter business performance metrics for the 2024 fiscal year, due next week, could give investors some insight into the company’s current operational positioning, which could be crucial for the share price performance as we advance. The key resistance level to look out for is R269.06, where the share price could either continue within the wedge toward R261.63 or leg out of the falling wedge toward its estimated fair value of R299.55, presenting a 12.6% potential upside from current levels.
Sources: Koyfin, Tradingview, Reuters, Sasol Limited
Piece written by Tiaan van Aswegen, Trive Financial Market Analyst
Disclaimer: Trive South Africa (Pty) Ltd, Registration number 2005/011130/07, and an Authorised Financial Services Provider in terms of the Financial Advisory and Intermediary Services Act 2002 (FSP No. 27231). Any analysis/data/opinion contained herein are for informational purposes only and should not be considered advice or a recommendation to invest in any security. The content herein was created using proprietary strategies based on parameters that may include price, time, economic events, liquidity, risk, and macro and cyclical analysis. Securities involve a degree of risk and are volatile instruments. Market and economic conditions are subject to sudden change, which may have a material impact on the outcome of financial instruments and may not be suitable for all investors. When trading or investing in securities or alternative products, the value of the product can increase or decrease meaning your investment can increase or decrease in value. Past performance is not an indication of future performance. Trive South Africa (Pty) Ltd, and its employees assume no liability for any loss or damage (direct, indirect, consequential, or inconsequential) that may be suffered from using or relying on the information contained herein. Please consider the risks involved before you trade or invest.