
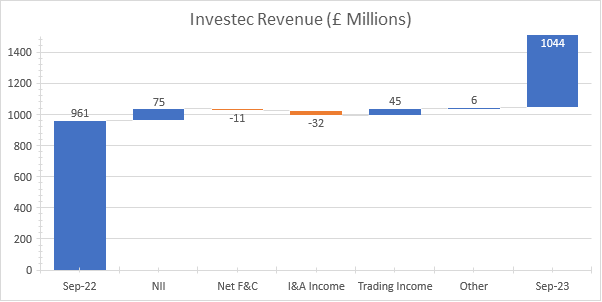
Investec Group (JSE: INL) is on its way to a fourth consecutive week of gains as its bullish momentum catches the market’s attention. The catalyst behind this upward trajectory lies in the company’s latest interim earnings report, unveiling a notable uptick in revenue from £960.7 million to a robust £1.04 billion.
Delving into the numbers, the group’s profits have experienced a commendable ascent. The driving forces behind this upward surge encompass heightened loan volumes, expanded corporate deposits, and a flourishing portfolio of funds under management. This financial prowess is vividly illustrated by the surge in profit attributable to shareholders for the six months ending on September 30, 2023, escalating from £478.1 million to a noteworthy £614.9 million.
Zooming in further on the market metrics, headline earnings per share shine at 36.9 pence per share, attesting to the group’s solid financial performance. Additionally, shareholders have cause for celebration with the declaration of an interim dividend of 15.5 pence per share.
Technical
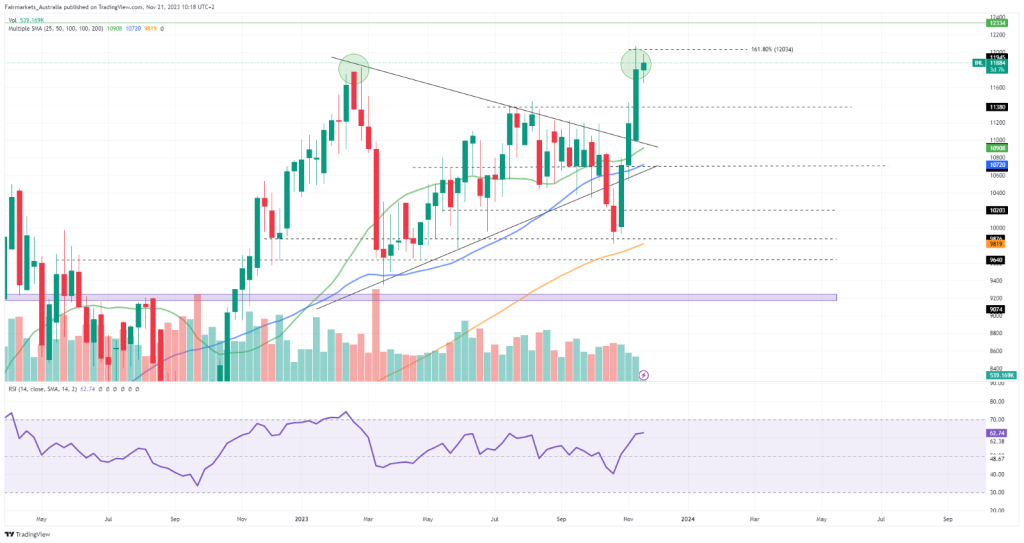
On the weekly chart, the share price broke through a symmetrical triangle, with the 25-SMA (green line) maintaining its positioning above the longer-term 50-SMA (blue line) and 100-SMA (orange line) to confirm the bullish momentum in the shorter term. However, the 161.8% Fibonacci extension provides resistance at R120.34, a psychological level that the share price previously failed to clear, opening the possibility for a near-term pullback.
Should the price remain below this resistance level, a pullback could occur toward R113.80, where the initial breakout from the triangle occurred. This could be a possible inflexion point, where the price could either find buyers to confirm the sustainability of the initial breakout or fall back for a longer-term downtrend. If buyers are found, the price could look toward its estimated fair value at R123.34, which presents a 3.6% potential upside from current levels.
However, a breakdown below R113.80 could bring the 25-SMA and 50-SMA into play at R109.09 and R107.20, respectively. Crossing below these support levels could signify a shift in momentum to the downside, bringing lower support at R102.03 and R98.76 into play as we advance.
Fundamental
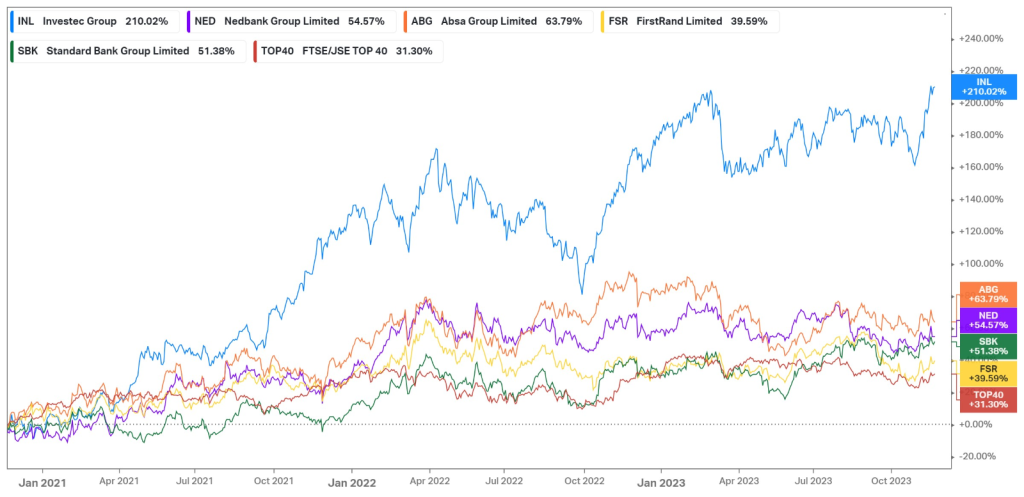
The last three years have been characterized by elevated inflation, rising interest rates, and persistent market volatility, which has painted a challenging economic picture for most businesses operating in South Africa. However, the financial services sector has stood tall, benefitting from the rising interest rates through the generation of net interest income, which has led to the outperformance of most financial companies relative to the JSE Top 40 index, as shown below. Investec, in particular, has been on a strong uptrend, with its share price appreciating over 210% over the last three years. The strong performance can partly be attributed to Investec’s reliance on a wealthy client base of private clients who are more able to navigate inflationary pressures and high interest rates. This is reflected by the 1.9% year-over-year rise in customer deposits in its latest interim period to £39.9Bn, allowing the company to grow its loan book by 4% to £31.0Bn, while its funds under management (FUM) in South Africa increased by 2% to £20.2Bn, driven by discretionary net inflows.
The benefits of higher interest rates are further shown below, as the company’s revenue growth was mainly generated by double-digit growth in net interest income (NII), as strong corporate loan growth boosted its top line. Net Fees & Commissions (F&C) and Investment & Associate Income (I&A) slightly offset these benefits, but revenue ultimately increased by 8.6% year-over-year. As we advance, the company expects its top line to be underpinned by moderate book growth and elevated interest rates and remain well positioned to continue supporting its clients amid the macroeconomic uncertainty, as it maintains a liquid balance sheet with strong capital ratios, painting an optimistic picture for the company’s prospects.
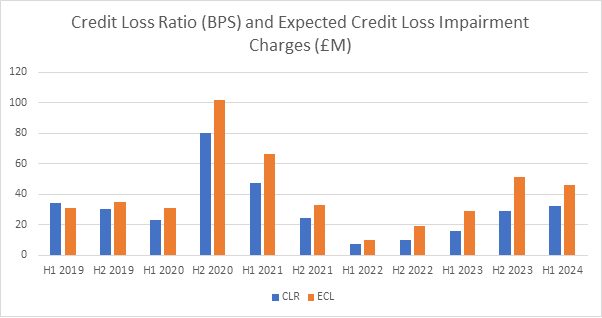
However, the graph below demonstrates an uptick in the company’s credit loss ratio (CLR), which presents the number of bad loans versus its total loans. In the recent interim period, this ratio increased from 16bps (0.16%) to 32bps (0.32%), reflecting the tight monetary conditions and elevated client stresses in the economy. However, this remains within the group’s through-the-cycle (TTC) range of 25bps – 35bps, albeit at the higher end, and management expects this ratio to remain within this range throughout the 2024 fiscal year. Similarly, after a few periods of decline, its expected credit loss (ECL) impairment charges increased from £29.4M in the year-ago period to £46.3M. However, compared to the previous interim period, this metric has declined, reflecting the quality of the company’s assets, with its exposures well covered by collateral.
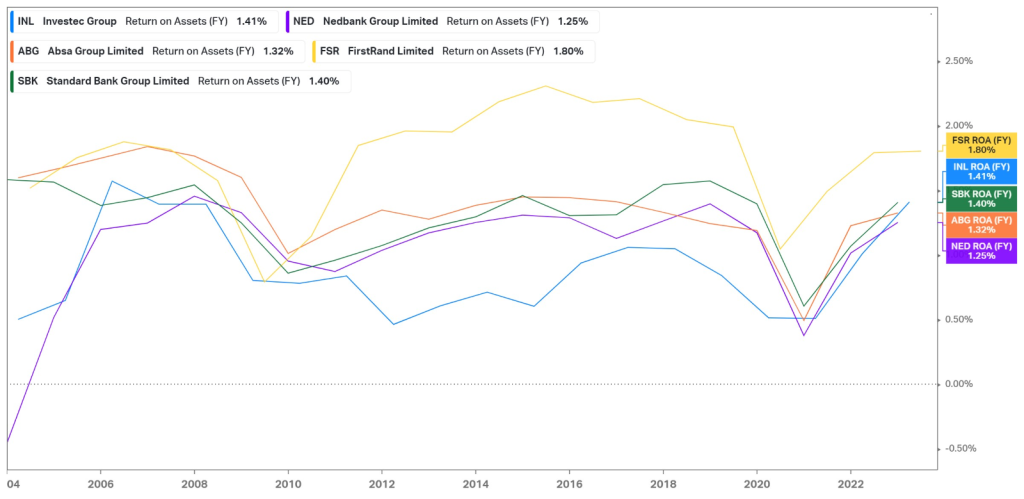
At the end of the day, financial services companies are tasked with generating sufficient net income with the assets on their balance sheet. The graph below demonstrates Investec’s improving efficiency in this regard. Historically, it ranked among the lowest within its industry in this metric, but it has recently catapulted itself close to the top. With a Return on Assets (ROA) of 1.41%, its efficiency has improved significantly, allowing it to generate more profits from smaller investments, which is a favourable position to be in when the consumer’s budget is tight and deposits are not flowing in as seamlessly. With an improving ROA and growing customer deposits against a challenging macroeconomic backdrop, Investec has positioned itself well in the industry to navigate the current economic uncertainties.
Summary
After an impressive interim earnings report, Investec looks well on track for its fourth consecutive week of gains. As we advance, investors could look toward resistance at R120.34 as a critical level, as it could determine whether the current breakout will sustain toward the estimated fair value of R123.34 or whether a pullback is on the cards, which could bring support at R113.80 into play.
Sources: Koyfin, Tradingview, Reuters, Investec Group
Piece written by Tiaan van Aswegen, Trive Financial Market Analyst
Disclaimer: Trive South Africa (Pty) Ltd, Registration number 2005/011130/07, and an Authorised Financial Services Provider in terms of the Financial Advisory and Intermediary Services Act 2002 (FSP No. 27231). Any analysis/data/opinion contained herein are for informational purposes only and should not be considered advice or a recommendation to invest in any security. The content herein was created using proprietary strategies based on parameters that may include price, time, economic events, liquidity, risk, and macro and cyclical analysis. Securities involve a degree of risk and are volatile instruments. Market and economic conditions are subject to sudden change, which may have a material impact on the outcome of financial instruments and may not be suitable for all investors. When trading or investing in securities or alternative products, the value of the product can increase or decrease meaning your investment can increase or decrease in value. Past performance is not an indication of future performance. Trive South Africa (Pty) Ltd, and its employees assume no liability for any loss or damage (direct, indirect, consequential, or inconsequential) that may be suffered from using or relying on the information contained herein. Please consider the risks involved before you trade or invest.