On Wednesday, the Australian 200 index (ASX: S&P/ASX 200) experienced a substantial surge, marking its most significant increase in over a year. The impetus behind this notable rise was the release of GDP growth statistics, with financial and mining stocks taking the lead. Contrary to market expectations, the quarter-on-quarter GDP growth slowed from 0.4% to 0.2%, boosting the demand for riskier assets.
The current index level is at its highest since late September, signalling a positive market sentiment. Investors are factoring in the likelihood of interest rates remaining steady at 4.35%, and there’s a growing belief that rate cuts may occur sooner than anticipated. This development adds an extra layer of intrigue to the market dynamics, making it an exciting time for traders ahead of Friday’s pivotal NFP release in the US.
Technical
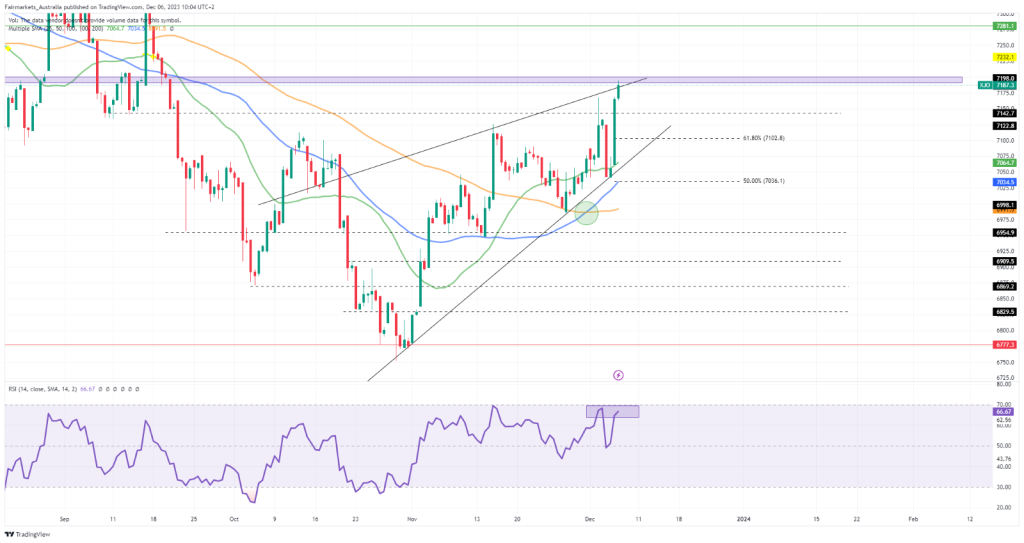
On the 4H chart, the recent uptrend has resulted in the formation of a rising wedge, leaving open the door for a potential breakdown in the upcoming sessions. However, the 25-SMA (green line) trades above the longer-term SMAs, and with the 50-SMA (blue line) recently crossing above the 100-SMA (orange line), the momentum is tilting toward the bullish side.
The supply zone at 7,198.0 is a critical one in the upcoming sessions, potentially offering resistance to the current momentum. If a pullback occurs, support at 7,142.7 could come into play, with the 61.8% Fibonacci golden ratio being present at the dynamic support of 7,102.8. While strong support may exist here, a breakdown could lead the index toward 7,036.1, the Fibonacci midpoint, where it converges with the 50-SMA.
However, if the supply zone fails to contain the momentum, the recent bullish surge could continue through the end of the week. Higher resistance is established at 7,281.1 and could be a critical level to the longer-term trend of the index.
Summary
After Australia’s GDP figures missed consensus, the Australian 200 index soared to new 11-month highs. As we advance, the supply zone at 7,198.0 could be critical in determining whether the rising wedge will result in a breakdown.
Sources: Koyfin, Tradingview
Piece written by Tiaan van Aswegen, Trive Financial Market Analyst
Disclaimer: Trive South Africa (Pty) Ltd, Registration number 2005/011130/07, and an Authorised Financial Services Provider in terms of the Financial Advisory and Intermediary Services Act 2002 (FSP No. 27231). Any analysis/data/opinion contained herein are for informational purposes only and should not be considered advice or a recommendation to invest in any security. The content herein was created using proprietary strategies based on parameters that may include price, time, economic events, liquidity, risk, and macro and cyclical analysis. Securities involve a degree of risk and are volatile instruments. Market and economic conditions are subject to sudden change, which may have a material impact on the outcome of financial instruments and may not be suitable for all investors. When trading or investing in securities or alternative products, the value of the product can increase or decrease meaning your investment can increase or decrease in value. Past performance is not an indication of future performance. Trive South Africa (Pty) Ltd, and its employees assume no liability for any loss or damage (direct, indirect, consequential, or inconsequential) that may be suffered from using or relying on the information contained herein. Please consider the risks involved before you trade or invest.