
The AUDNZD has been trading lower in recent weeks, driven by a combination of factors, including weaker-than-expected Australian GDP growth, a dovish outlook from the Reserve Bank of Australia (RBA), and a stronger New Zealand dollar.
Australian GDP grew just 0.2% in the third quarter of 2023, below market expectations of 0.4%. This was due to a number of factors, including rising borrowing costs, tax payments, and a decline in household spending.
The RBA has also turned dovish in recent months, signalling that it is no longer in a hurry to raise interest rates. This is in contrast to the Reserve Bank of New Zealand (RBNZ), which is expected to continue raising rates in the coming months.
The New Zealand dollar has also been strong in recent weeks, supported by expectations of higher interest rates. This has put additional downward pressure on the AUDNZD.
Technical Analysis
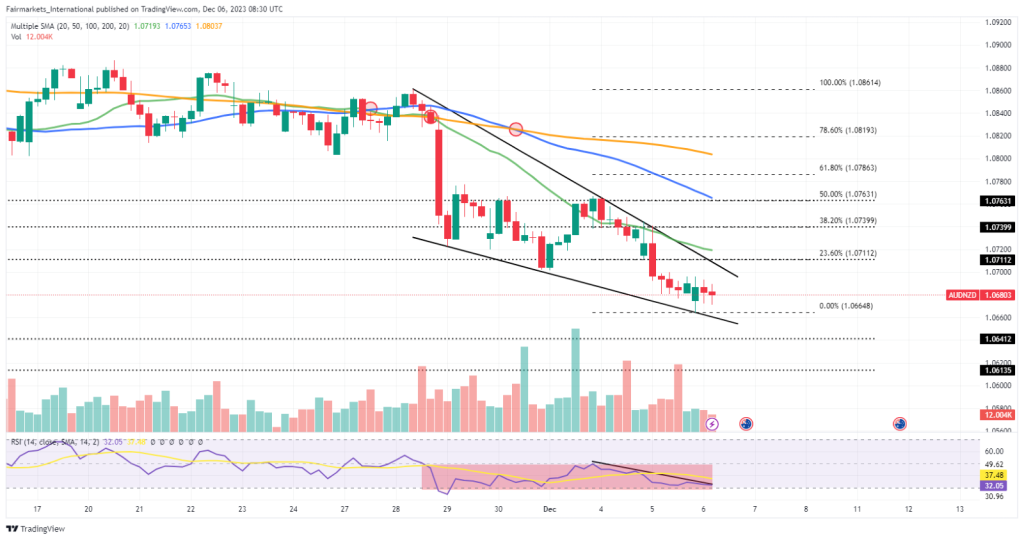
The AUDNZD is currently trading at 1.06803, within a falling wedge trading pattern and below its key moving averages. The 20-SMA (green line), 50-SMA (blue line), and 100-SMA (orange line) are all sloping downwards, indicating that the bears are in control of the market.
The RSI is also bearish, currently at 32.05. This suggests that the AUDNZD is oversold and could be due for a rebound. However, the RSI-based MA is also bearish, at 37.48. This suggests that the bears are still in control of the market.
Short-term trading opportunities could exist towards the resistance level at the 1.07112 price level should the break above the wedge materialize. A break above the initial resistance could confirm the bullish momentum, likely bringing the 1.07399 and 1.07631 resistance levels into play.
However, short-term trading opportunities could arise towards the initial support at 1.06412 should the bears sustain a push lower. A break below the 1.06412 level would likely bring the 1.06135 support levels into play in the short term.
Summary
The AUDNZD faces conflicting fundamental forces with divergent central bank outlooks. Technically, a potential wedge breakout towards the 1.07112 resistance level may decide the short-term trend.
However, continued bearish momentum would likely leave the 1.06412 support level within the bears’ reach in the coming sessions.
Sources: TradingView, Trading Economics, Statistics South Africa, Reuters, Business Recorder.
Piece written by Mfanafuthi Mhlongo, Trive Financial Market Analyst
Disclaimer: Trive South Africa (Pty) Ltd, Registration number 2005/011130/07, and an Authorised Financial Services Provider in terms of the Financial Advisory and Intermediary Services Act 2002 (FSP No. 27231). Any analysis/data/opinion contained herein are for informational purposes only and should not be considered advice or a recommendation to invest in any security. The content herein was created using proprietary strategies based on parameters that may include price, time, economic events, liquidity, risk, and macro and cyclical analysis. Securities involve a degree of risk and are volatile instruments. Market and economic conditions are subject to sudden change, which may have a material impact on the outcome of financial instruments and may not be suitable for all investors. When trading or investing in securities or alternative products, the value of the product can increase or decrease meaning your investment can increase or decrease in value. Past performance is not an indication of future performance. Trive South Africa (Pty) Ltd, and its employees assume no liability for any loss or damage (direct, indirect, consequential, or inconsequential) that may be suffered from using or relying on the information contained herein. Please consider the risks involved before you trade or invest.