
Vodacom Group Limited’s (JSE: VOD) share price has faced headwinds in the first week of May, extending a year-to-date decline of over 15.7%. Despite the recent weakness, the company’s full-year results for the period ended March 31, 2024, paint a somewhat mixed picture.
On the positive side, Vodacom delivered strong group revenue growth of 26.4%, driven by the acquisition of Vodafone Egypt. Group service revenue also grew by a healthy 29.1%, with pro-forma growth (excluding Egypt) coming in at a respectable 9.2%. The company boasts a robust customer base of 203.1 million across Africa, demonstrating its strong market position. Furthermore, Vodacom’s commitment to innovation is evident in its target of achieving 25-30% of group service revenue from new services in the medium term. This focus on diversification bodes well for future growth prospects.
However, the rosy picture is marred by a 10.8% decline in full-year headline earnings. Start-up losses in Ethiopia, rising finance and energy costs, and inflationary pressures all contributed to this decline. The uncertain global economic outlook further complicates the situation.
Technical Analysis
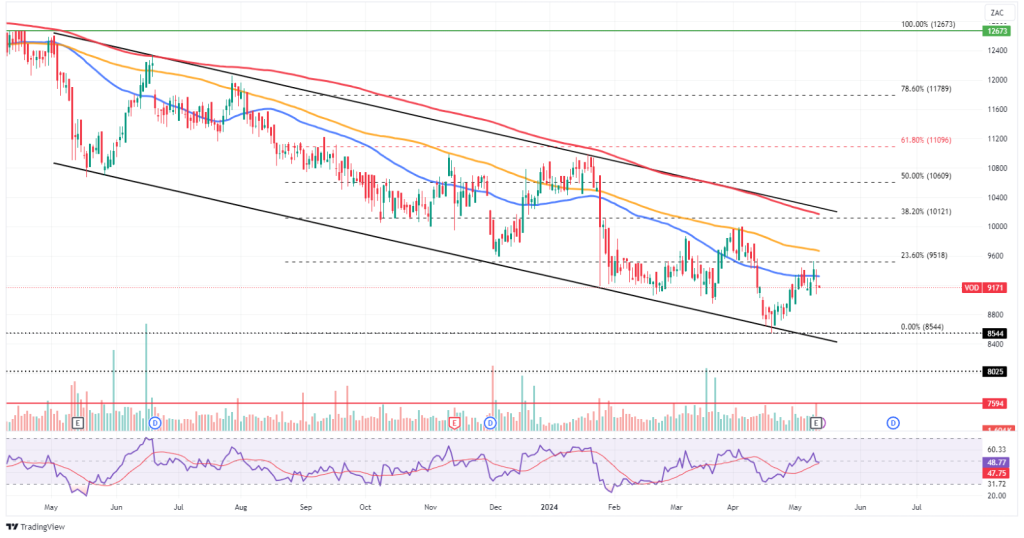
The daily chart shows that Vodacom’s share price currently sits at 9,171 cents, within a descending channel pattern. This suggests a potential downtrend. The price remains below the key moving averages [50-SMA (blue line), 100-SMA (orange line), and 200-SMA (red line)], further indicating bearish pressure. Additionally, the RSI hovers around 48.77, suggesting neither strong buying nor selling sentiment.
However, there are potential signs of a bullish reversal. A break above the 23.60% Fibonacci retracement level (9,788 cents) could signal a shift in momentum, with resistance at the 38.20% level (10,121 cents) potentially limiting further upside. A sustained breakout above both resistance levels could lead to a test of the 50.00% Fibonacci retracement (10,609 cents) and the 61.80% level (11,096 cents) in the coming sessions.
Conversely, a break below the recent swing low of 8,544 cents could indicate a continuation of the downtrend. Significant selling volume on a breach of this support level might drag the price towards 8,025 cents and 7,594 cents in the short term.
Summary
Vodacom’s fundamentals present a mixed bag. While the company exhibits strong revenue growth and a commitment to innovation, profitability has been impacted by recent challenges. Technically, the share price faces resistance from the descending channel and key moving averages. However, a sustained push above the 23.60% Fibonacci retracement level (9,734 cents) could signal a potential bullish breakout.
Sources: TradingView, Trading Economics, Reuters, Vodacom, Dow Jones Newswire.
Piece written by Mfanafuthi Mhlongo, Trive Financial Market Analyst
Disclaimer: Trive South Africa (Pty) Ltd (hereinafter referred to as “Trive SA”), with registration number 2005/011130/07, is an authorised Financial Services Provider in terms of the Financial Advisory and Intermediary Services Act, 37 of 2002. Trive SA is authorised and regulated by the South African Financial Sector Conduct Authority (FSCA) and holds FSP number 27231. Trive Financial Services Ltd (hereinafter referred to as “Trive MU”) holds an Investment Dealer (Full-Service Dealer, excluding Underwriting) Licence with licence number GB21026295 pursuant to section 29 of the Securities Act 2005, Rule 4 of the Securities Rules 2007, and the Financial Services Rules 2008. Trive MU is authorized and regulated by the Mauritius Financial Services Commission (FSC) and holds Global Business Licence number GB21026295 under Section 72(6) of the Financial Services Act. Trive SA and Trive MU are collectively known and referred to as “Trive Africa”.
Market and economic conditions are subject to sudden change which may have a material impact on the outcome of financial instruments and may not be suitable for all investors. Trive Africa and its employees assume no liability for any loss or damage (direct, indirect, consequential, or inconsequential) that may be suffered. Please consider the risks involved before you trade or invest. All trades on the Trive Africa platform are subject to the legal terms and conditions to which you agree to be bound. Brand Logos are owned by the respective companies and not by Trive Africa. The use of a company’s brand logo does not represent an endorsement of Trive Africa by the company, nor an endorsement of the company by Trive Africa, nor does it necessarily imply any contractual relationship. Images are for illustrative purposes only and past performance is not necessarily an indication of future performance. No services are offered to stateless persons, persons under the age of 18 years, persons and/or residents of sanctioned countries or any other jurisdiction where the distribution of leveraged instruments is prohibited, and citizens of any state or country where it may be against the law of that country to trade with a South African and/or Mauritius based company and/or where the services are not made available by Trive Africa to hold an account with us. In any case, above all, it is your responsibility to avoid contravening any legislation in the country from where you are at the time.
CFDs and other margin products are complex instruments and come with a high risk of losing money rapidly due to leverage. You should consider whether you understand how these products work and whether you can afford to take the high risk of losing your money. Professional clients can lose more than they deposit. See our full Risk Disclosure and Terms of Business for further details. Some or all of the services and products are not offered to citizens or residents of certain jurisdictions where international sanctions or local regulatory requirements restrict or prohibit them.