Sasol Limited (JSE: SOL), a prominent player in the chemical and energy sectors, has recently attracted attention due to fluctuations in its share price. Amid a challenging economic landscape, Sasol has faced substantial market scrutiny, with its market value plummeting by over 25% year-to-date, indicating waning investor confidence. However, a glimmer of optimism emerged last week as the company’s shares rallied by 5.68% following several weeks of losses.
The downturn in Sasol’s share price can be attributed to various factors, notably challenges in its Mining and Secunda Operations, which contributed to a downward revision in volume expectations. Operational headwinds in its core Mining and Secunda Operations are expected to limit production volumes to a maximum of 7.1 million tons for the year, falling short of the initial guidance of 7.3 million tons.
Additionally, subdued prices across the chemicals sector, fuelled by global economic conditions and weakened demand in key markets like China and Europe, further dampened investor sentiment. Sales revenue in this segment was down 15%, with average sales basket prices plummeting 20% compared to the same period last year. As Sasol navigates these operational and market challenges, the question arises: can the recent rebound in its share price be sustained?
Technical
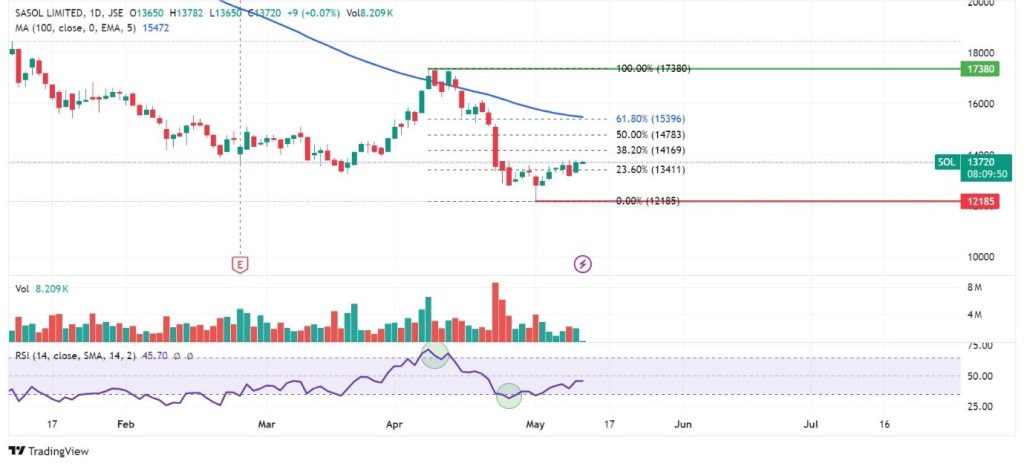
Sasol’s recent price action reflects a nuanced interplay of technical indicators and market sentiment. Trading within a downtrend, the share price dipped below the 100-day moving average, signalling bearish momentum.
Initially, a brief upturn aligned the share price with this moving average, but overbought RSI conditions stifled further gains, resulting in a resistance level of R173.80 per share. Subsequently, the share price retreated, finding support at R121.85 per share amid oversold RSI conditions, prompting a rebound.
Currently, the price has retraced past the 23.60% Fibonacci Retracement level, indicating potential for further upside. Should bullish momentum persist, the 50% Fibonacci level may become a focal point for upside targets. Conversely, a resurgence of bearish pressures could lead to a retest of the R121.85 support level.
Summary
Sasol’s resilience is tested amidst operational challenges and market uncertainties, with shares plummeting 25% year-to-date. Despite a recent 5.68% rebound, attention turns to pivotal technical levels such as the R173.80 resistance and R121.85 support, shaping the stock’s trajectory amidst evolving market dynamics.
Sources: Sasol Limited, Reuters, TradingView
Piece Written By Nkosilathi Dube, Trive Financial Market Analyst
Disclaimer: Trive South Africa (Pty) Ltd (hereinafter referred to as “Trive SA”), with registration number 2005/011130/07, is an authorised Financial Services Provider in terms of the Financial Advisory and Intermediary Services Act, 37 of 2002. Trive SA is authorised and regulated by the South African Financial Sector Conduct Authority (FSCA) and holds FSP number 27231. Trive Financial Services Ltd (hereinafter referred to as “Trive MU”) holds an Investment Dealer (Full-Service Dealer, excluding Underwriting) Licence with licence number GB21026295 pursuant to section 29 of the Securities Act 2005, Rule 4 of the Securities Rules 2007, and the Financial Services Rules 2008. Trive MU is authorized and regulated by the Mauritius Financial Services Commission (FSC) and holds Global Business Licence number GB21026295 under Section 72(6) of the Financial Services Act. Trive SA and Trive MU are collectively known and referred to as “Trive Africa”.
Market and economic conditions are subject to sudden change which may have a material impact on the outcome of financial instruments and may not be suitable for all investors. Trive Africa and its employees assume no liability for any loss or damage (direct, indirect, consequential, or inconsequential) that may be suffered. Please consider the risks involved before you trade or invest. All trades on the Trive Africa platform are subject to the legal terms and conditions to which you agree to be bound. Brand Logos are owned by the respective companies and not by Trive Africa. The use of a company’s brand logo does not represent an endorsement of Trive Africa by the company, nor an endorsement of the company by Trive Africa, nor does it necessarily imply any contractual relationship. Images are for illustrative purposes only and past performance is not necessarily an indication of future performance. No services are offered to stateless persons, persons under the age of 18 years, persons and/or residents of sanctioned countries or any other jurisdiction where the distribution of leveraged instruments is prohibited, and citizens of any state or country where it may be against the law of that country to trade with a South African and/or Mauritius based company and/or where the services are not made available by Trive Africa to hold an account with us. In any case, above all, it is your responsibility to avoid contravening any legislation in the country from where you are at the time.
CFDs and other margin products are complex instruments and come with a high risk of losing money rapidly due to leverage. You should consider whether you understand how these products work and whether you can afford to take the high risk of losing your money. Professional clients can lose more than they deposit. See our full Risk Disclosure and Terms of Business for further details. Some or all of the services and products are not offered to citizens or residents of certain jurisdictions where international sanctions or local regulatory requirements restrict or prohibit them.