
The South African Rand (ZAR) treads water against the US Dollar (USD) after a downbeat day, mirroring cautious market sentiment. The Rand’s weakness stemmed from a stronger USD, fuelled by hotter-than-expected US inflation data. This data dimmed hopes of a near-term Federal Reserve interest rate cut, boosting the USD’s appeal.
Locally, the Rand’s woes were compounded by underwhelming economic data, revealing a significant decline in mining output and gold production. Investors now await South Africa’s upcoming inflation figures, seeking clarity on the nation’s economic trajectory.
Technical
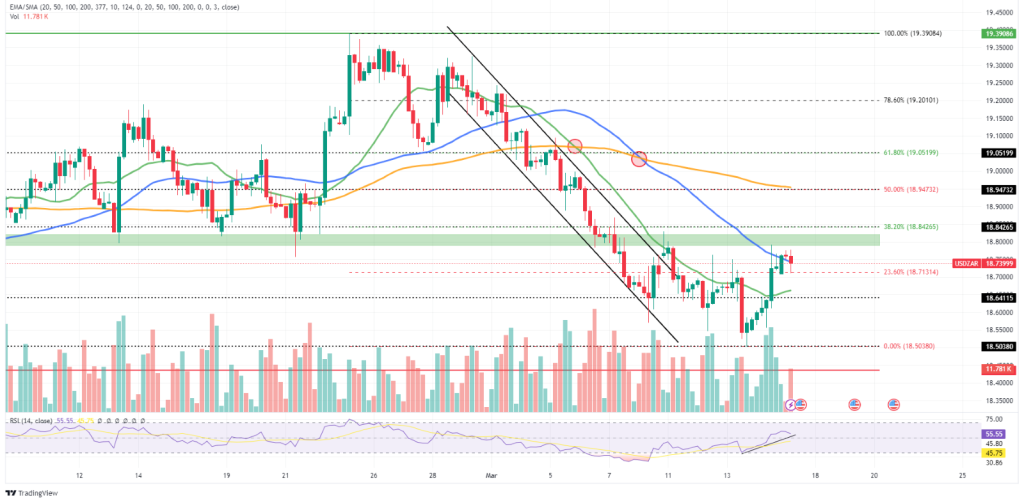
The USDZAR currency pair currently sits at R18.73999, exhibiting a lack of direction as the Rand attempts to resist recent USD dominance. Price action hovers around the 50-SMA (blue line) after breaching above the 20-SMA (green line). However, it remains comfortably below the downward-sloping 100-SMA (orange line), with both the 20-SMA and 50-SMA recently dipping below the 100-SMA.
The Relative Strength Index (RSI) (55.55) is losing momentum after climbing above the 50.00 level, suggesting potential short-term selling opportunities if the price action sustains a break below the initial support level of R18.64115, particularly with significant trading volume. A confirmed breach beneath this level could expose the last swing low of R18.50380 and the major support zone of R18.43523 to the bears.
Conversely, a sustained surge above the resistance zone could propel the price action towards the 38.20% Fibonacci retracement level (R18.84265). A confirmed breakout above this initial resistance could open doors to the 50.00% (R18.94732) and 61.80% (R19.05199) Fibonacci retracement levels as the next significant upside targets.
Market Sentiment:
Investor sentiment remains cautious due to the ongoing tug-of-war between the USD’s strength and the Rand’s resilience. The hotter-than-anticipated US inflation data has tempered expectations of a Federal Reserve rate cut, bolstering the USD. However, the Rand is finding some solace in the absence of strong selling pressure.
Technically, Rand’s ability to maintain its position above the 23.60% Fibonacci retracement level and the key moving averages will be crucial in determining the short-term direction. A breakout above the supply zone could ignite a bullish rally, while a sustained decline below the 23.60% Fibonacci retracement level could expose the US Dollar to further depreciation.
Sources: TradingView, Trading Economics, Reuters.
Piece written by Mfanafuthi Mhlongo, Trive Financial Market Analyst