After riding the wave of the recent artificial intelligence boom, Broadcom Inc. (NASDAQ: AVGO) has experienced a remarkable 48% boost in its stock price over the past nine months. Yet, there’s more to the story. While their latest earnings report exceeded expectations on all fronts, the future holds intriguing challenges as management sets a course slightly lower than anticipated. As the company faces the possibility of parting ways with a vital customer, it’s a high-stakes strategy game that could redefine the semiconductor landscape.
In its third-quarter earnings report, Broadcom reported a 5% year-on-year increase in revenue, propelling its top line to $8.88Bn. This figure slightly exceeded the $8.86Bn consensus, accompanying the bottom-line beat, as adjusted earnings per share (EPS) advanced from $9.73 to $10.54, above the expected $10.43. As the market processed the optimistic report, its share price surged by 3.43%, briefly hitting record highs before the downbeat forecasts from management triggered a retracement, eventually resulting in a longer-term pullback in the share price.
Technical
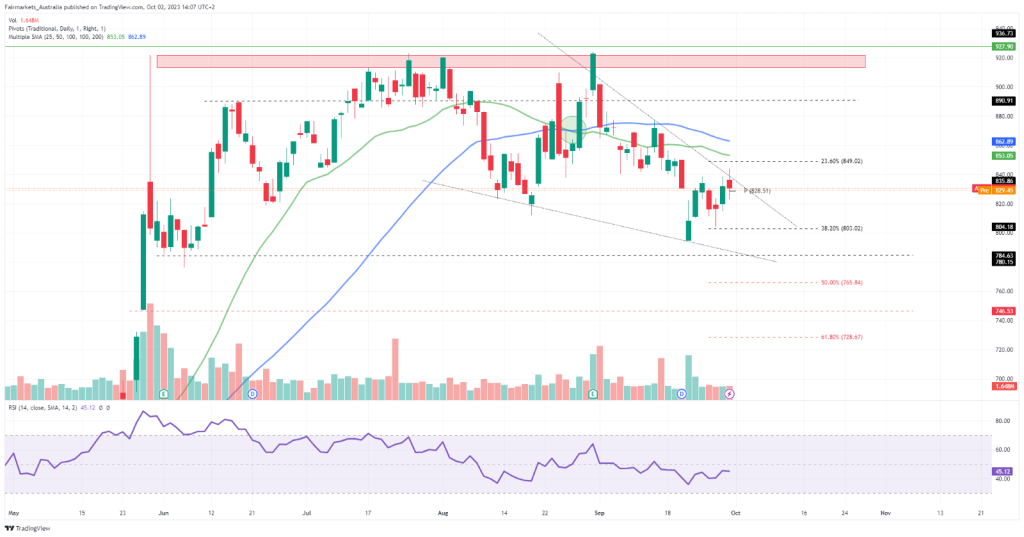
On the 1D chart, the retracement from the record highs has resulted in a falling wedge pattern, with the crossing of the 50-SMA (blue line) above the 25-SMA (green line) confirming the bearish momentum. However, with the daily pivot support at $828.51 keeping the bulls in play, the share price could prevent a wedge breakdown if it shifts above the dynamic resistance of the wedge toward $849.02, the 23.6% Fibonacci retracement level.
Strong resistance is established with the 25-SMA and 50-SMA not trading far above this level, which could prevent a sustainable upside in the shorter term. Failure to move above $849.02 could entice the sellers to initiate the wedge breakdown toward $803.02 and $784.63, which is established close to the wedge support. A move below these levels could trigger a sustainable downtrend toward $765.84, the Fibonacci midpoint, before testing lower support at $746.53 and $728.67, the 61.8% Fibonacci golden ratio.
However, a breach of resistance at $849.02 could underpin the upside potential, with resistance at $890.91 then becoming the first potential level of interest. A strong supply zone at its record highs then stands in the way of the share price reaching its estimated fair value of $927.90, which presents an 11.69% potential upside from current levels.
Fundamental
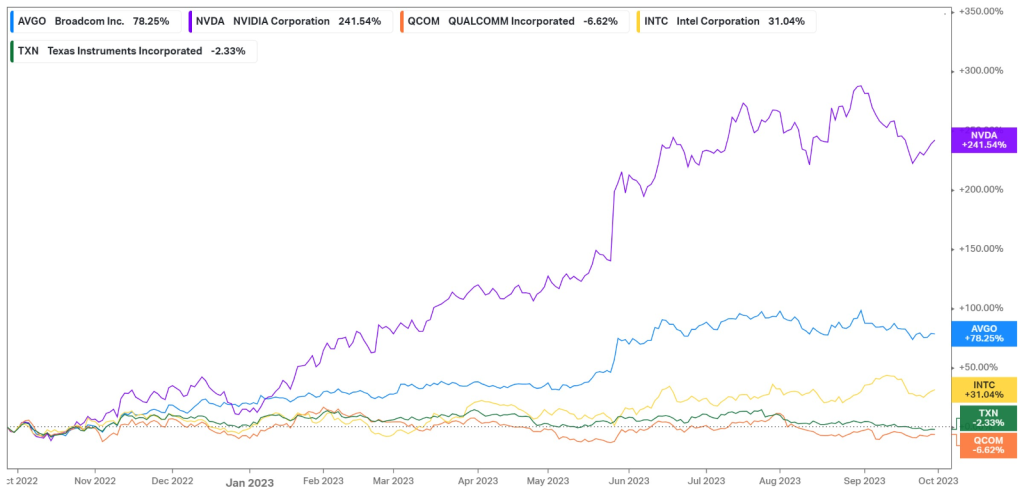
Over the past year, Broadcom has advanced 78.25%, delivering stellar price appreciation due to its lucrative growth prospects in the artificial intelligence (AI) space. Last quarter, management revealed their expectations for sales related to AI to double this year, as they have an attractive positioning in the semiconductor space. Its latest quarter results were driven by the increasing demand for next-generation networking technologies, as hyper-scale customers are scaling out and networking AI clusters within data centres. The need for chips that power these data centres has seen companies like Broadcom and Nvidia (241.54%) unlock unprecedented demand potential. However, as demonstrated by the share price performance of these companies, it is clear that Nvidia remains the market leader, and with Google potentially dropping Broadcom to produce the necessary chips in-house, the company could fall even further behind Nvidia, whose management guided optimistically on the expected demand for upcoming quarters.
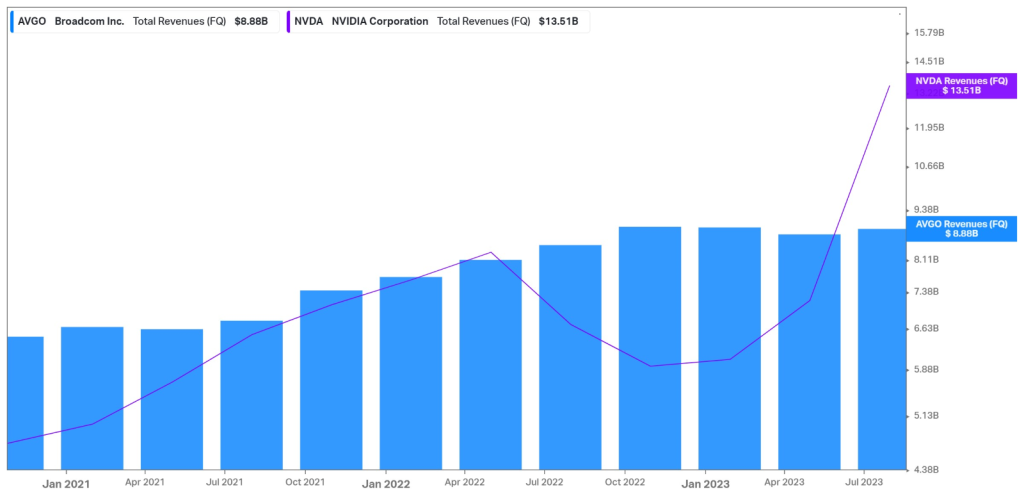
In the latest quarter, Broadcom’s revenue expanded 5% to $8.88Bn, with semiconductor solutions attributing $6.94Bn, up from the prior period’s $6.62Bn. Infrastructure solutions generated $1.94Bn, up from the previous $1.84Bn, rounding off a successful quarter on its top line. However, these numbers could be at risk in upcoming years, as an unconfirmed report came out saying that Google could opt for producing the tensor processing units (TPUs) in-house as its war with Microsoft toward gaining market share in the AI space continues. Earlier this year, it was estimated that Broadcom could receive around $3Bn in annual revenue from Google due to the AI-induced accelerator TPU orders from the technology behemoth. If these rumours come true, it could damage the company’s top line significantly. However, the timeline for these actions is set closer to 2027, and a spokesperson from Google has said that the company needs the benefits of collaborating with Broadcom to meet its internal and external cloud needs and cited that there has been no change in the engagement of Google with Broadcom. As a result, the share price pared its initial losses as the market corrected the overreaction to the report. However, the 5% increase in revenue failed to keep up with the surge in Nvidia’s top line, which has recently exceeded Broadcom’s after historically generating less revenue, as Nvidia now operates with a quarterly top line of $13.51Bn.
The potential acquisition of cloud-computing company VMware underpins the company’s top-line prospects, with the deal expected to close in the next few months. This merger could allow Broadcom to accelerate its adoption of cloud computing technologies, which is expected to provide its infrastructure software segment with an additional $14Bn in annual revenue. Despite this optimism, management guided for revenue of $9.27Bn in the fourth quarter, slightly lower than the market’s view of $9.29Bn. The company also expects to generate an EBITDA of 65% of revenue.
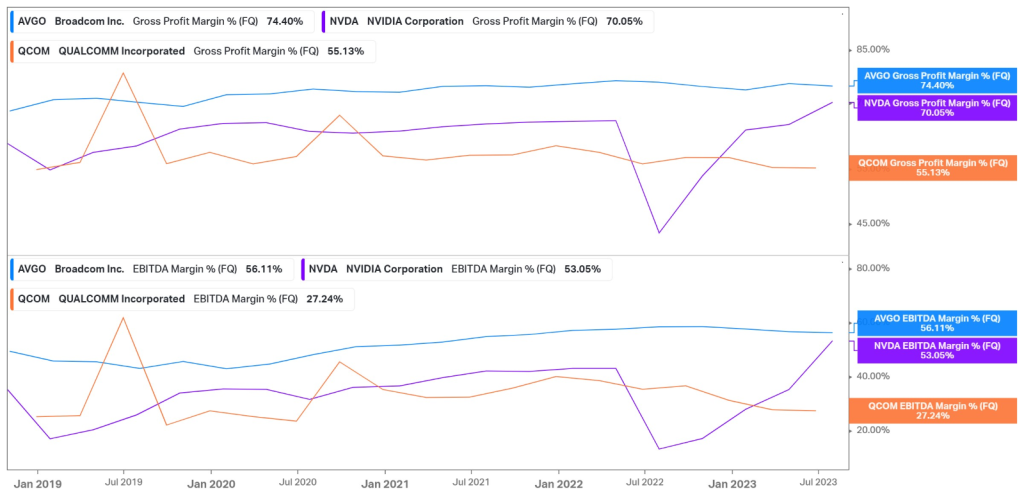
However, Broadcom’s efficiency and profitability still lead the industry despite generating less revenue than Nvidia. With a gross profit margin of 74.4%, it exceeds that of Nvidia (70.05%) and Qualcomm (55.13%). In addition, its EBITDA margin of 56.11% exceeds that of its peers. With the forecast for this margin to increase to 65% in the upcoming quarter, there could be a widening in the profitability gap, which poses well for the company’s future prospects.
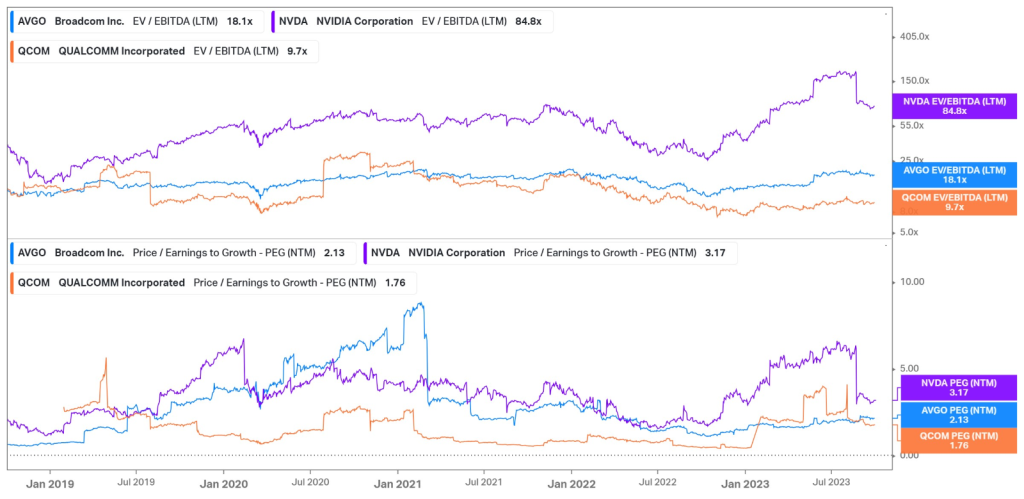
With the semiconductor industry flying high in the latest year, there has been a rise in the valuations of the underlying companies within the sector. Without necessarily producing sustainably higher cash flows and profitability, the growth prospects of these firms have enticed investors to attach a large premium on their price. Nvidia’s EV/EBITDA valuation has stretched to 84.8x, and when taking growth prospects into consideration, it operates with a PEG ratio of 3.17x. While being the industry leader, these valuations could justify its competitive positioning. On the other hand, Broadcom has less of a premium attached to it, trading with an EV/EBITDA ratio of 18.1x and a PEG ratio of 2.13x. While its top line has not seen as much of a rise from the AI adoptions, it trades slightly cheaper on a relative basis while still holding a competitive position in the industry.
Summary
Despite delivering a double beat in its latest earnings report, management’s guidance and the potential loss of Google as a critical customer have recently created some turbulent waters for Broadcom. If the price continues to pull back, the falling wedge could break down toward $765.84. However, the company’s estimated fair value is $927.90, which provides an 11.69% potential upside from current levels.
Sources: Koyfin, Tradingview, Investor’s Business Daily, Yahoo Finance, Broadcom Inc.
Piece written by Tiaan van Aswegen, Trive Financial Market Analyst
Disclaimer: Trive South Africa (Pty) Ltd, Registration number 2005/011130/07, and an Authorised Financial Services Provider in terms of the Financial Advisory and Intermediary Services Act 2002 (FSP No. 27231). Any analysis/data/opinion contained herein are for informational purposes only and should not be considered advice or a recommendation to invest in any security. The content herein was created using proprietary strategies based on parameters that may include price, time, economic events, liquidity, risk, and macro and cyclical analysis. Securities involve a degree of risk and are volatile instruments. Market and economic conditions are subject to sudden change, which may have a material impact on the outcome of financial instruments and may not be suitable for all investors. When trading or investing in securities or alternative products, the value of the product can increase or decrease meaning your investment can increase or decrease in value. Past performance is not an indication of future performance. Trive South Africa (Pty) Ltd, and its employees assume no liability for any loss or damage (direct, indirect, consequential, or inconsequential) that may be suffered from using or relying on the information contained herein. Please consider the risks involved before you trade or invest.